
“Angel of the North” sculpture by Antony Gormley, Gateshead, England
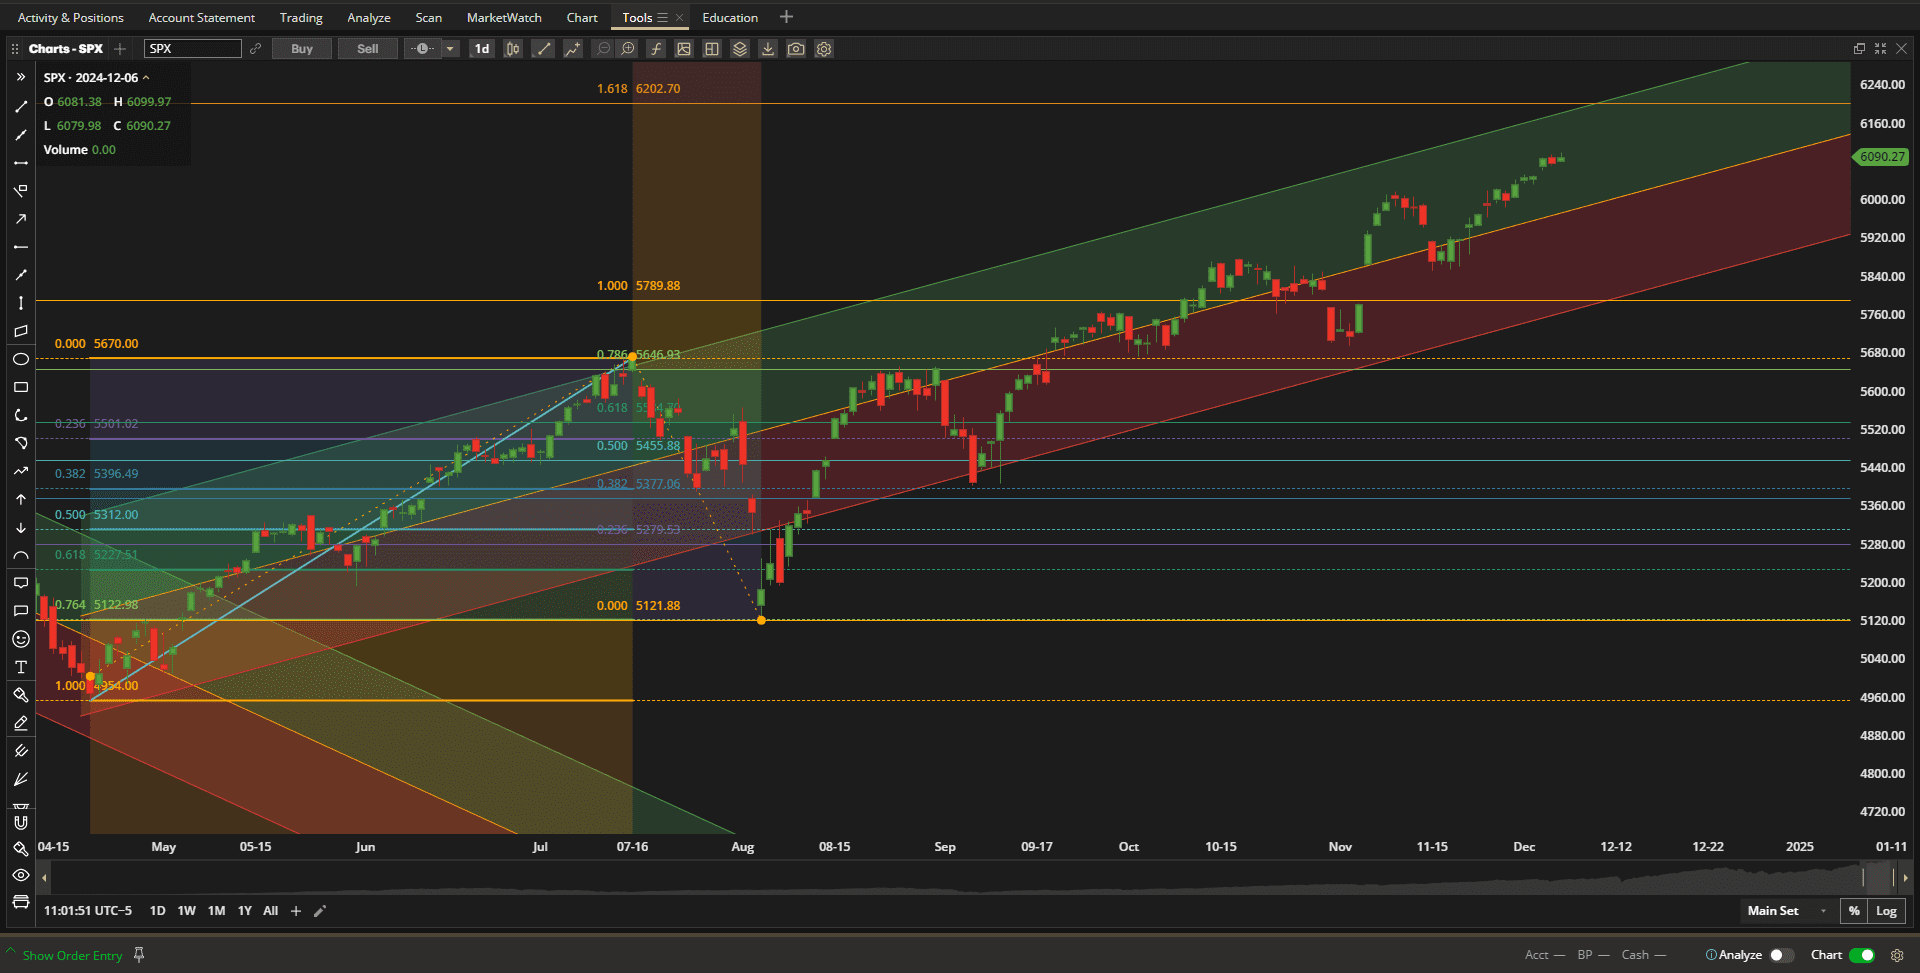
It was a relatively quiet week in the US Equity markets but the SPX (S&P 500 Index) eased through the 6000 resistance level and edged slightly higher for yet another week, closing at ~6090:
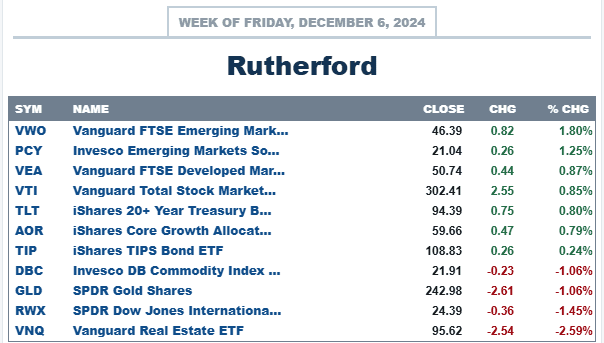
 In terms of relative performance, US Equities (as represented by VTI) closed in the middle of the pack with Emerging Markets showing the best performance in both equities and bonds:
 Current holdings in the Rutherford Portfolio look like this:
 after correcting for an omission that I made at the August adjustment, when I sold one position but did not record the allocation of funds received. This resulted in totals for the total portfolio (heavy red line) showing a level ~$2,500-$3,000 below where it should have been during the August-November period. The current performance picture looks like this:
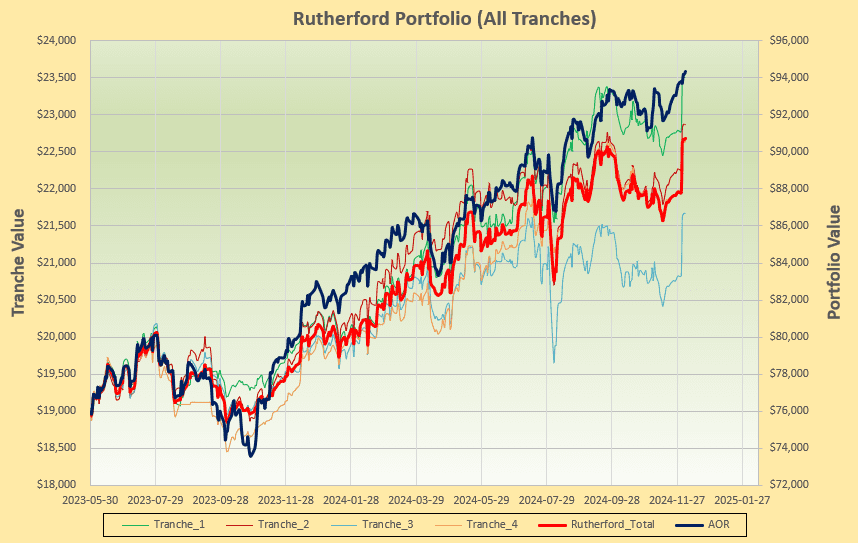 with the recent jump higher not being a “real” move but merely a correction of the missing funds from the drop seen in August – light blue (Tranche 3) line. The important observation here is that although performance has not kept up with the benchmark AOR fund (heavy blue line) the difference between the two graphs is not as large as I had been showing and this is now balanced with account statements.
Checking the rotation graphs: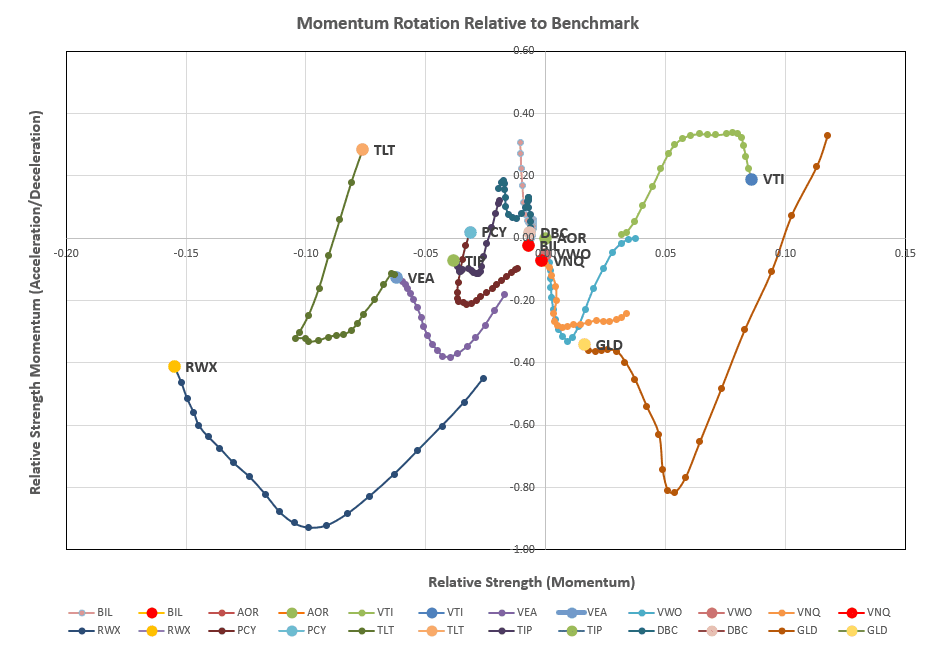
VTI remains the only asset sitting in the desirable top right quadrant – but even this is showing weakness in the shorter term (downward movement along the vertical axis).
The ranking/recommendation sheet looks a little more optimistic:
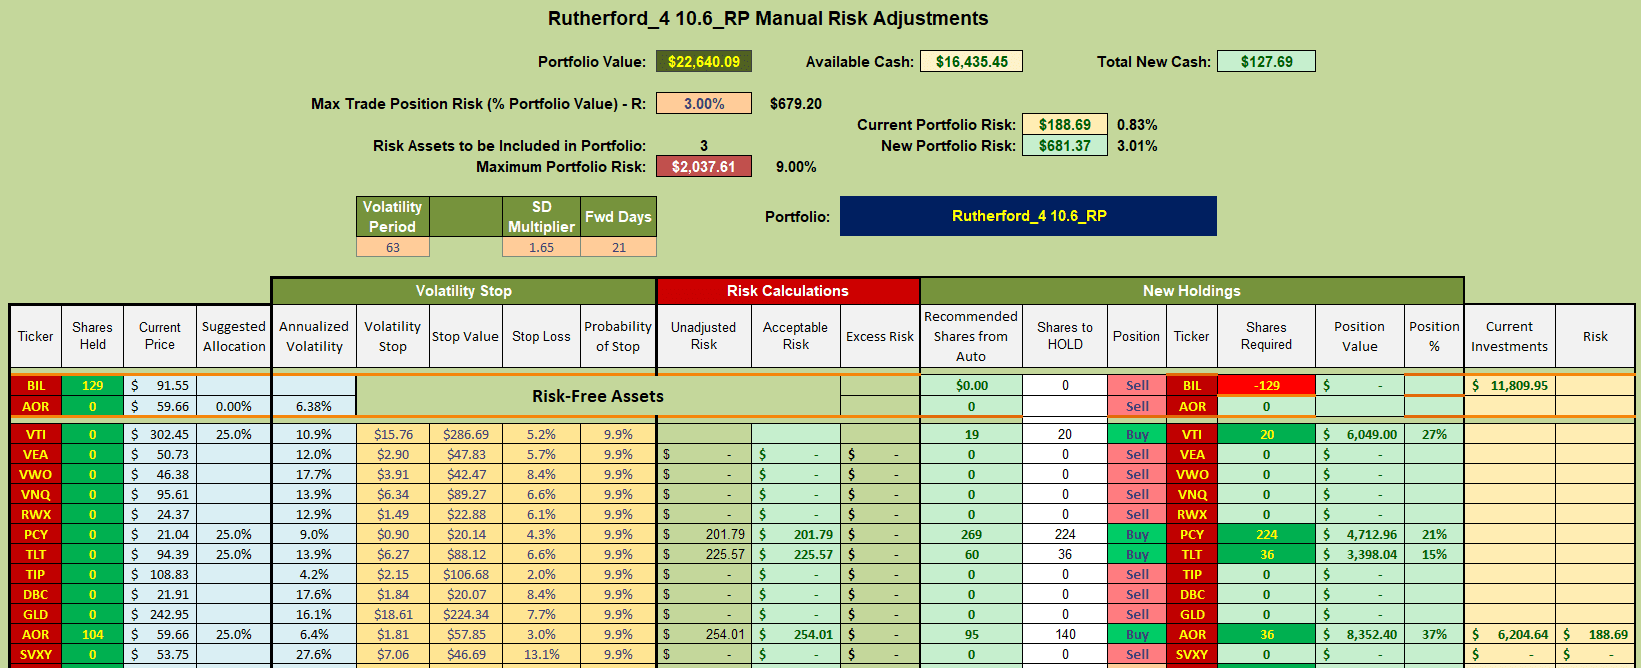
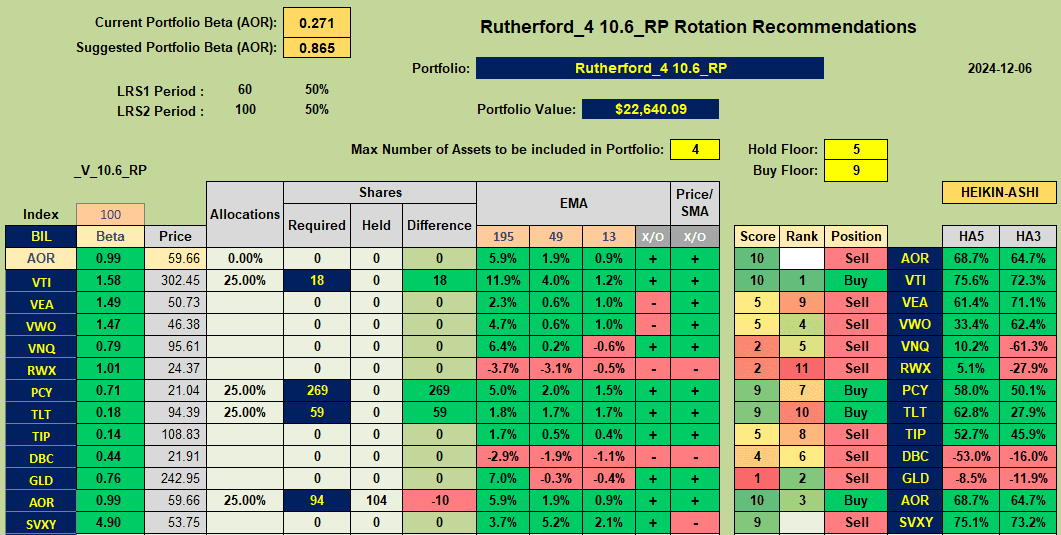 with VTI, PCY and TLT showing as recommended Buys. However, since I am winding this portfolio down at the end of the year I will not be making any adjustments this week – but the adjustments, if made, might look something like this:
Discover more from ITA Wealth Management
Subscribe to get the latest posts sent to your email.
Leave a Comment or Question