Boats on the Willamette River
As a follow up to the Bullish Percent Indicator (BPI) data presented earlier this morning, this review of the Carson (named after Rachel) lays out the logic an investor will use to manage a Sector BPI portfolio. The Carson is the oldest Sector BPI Plus portfolio and therefore provides one with the most viable performance and risk data. The Carson will soon enter its second year of operation.
Readers will find different Internal Rate of Return data in this review due to different assets employed by the portfolio. I’ll explain, as I generally do, when going through the following review.
Carson Investment Quiver and Holdings
Over the last few months I’ve been culling the investment quiver down to the essential holdings. If one wished to further simplify the U.S. Equities option, one could eliminate two of the three (VTI, VOO, ESGV) ETFs. I likely would hold on to either VTI or VOO if I were to reduce the equity ETF number to one. Since this is a Sector BPI Plus portfolio the eleven sectors (light background) will always remain part of the investment quiver.
Pay attention to the third column from the left. The percentages associated with the eleven sector ETFs are based on three years of volatility data. The percentages 9.1% down through 8.5% add up to close to 100%. The percentages associated with VTI, VOO, and ESGV are values selected by the author of this post.

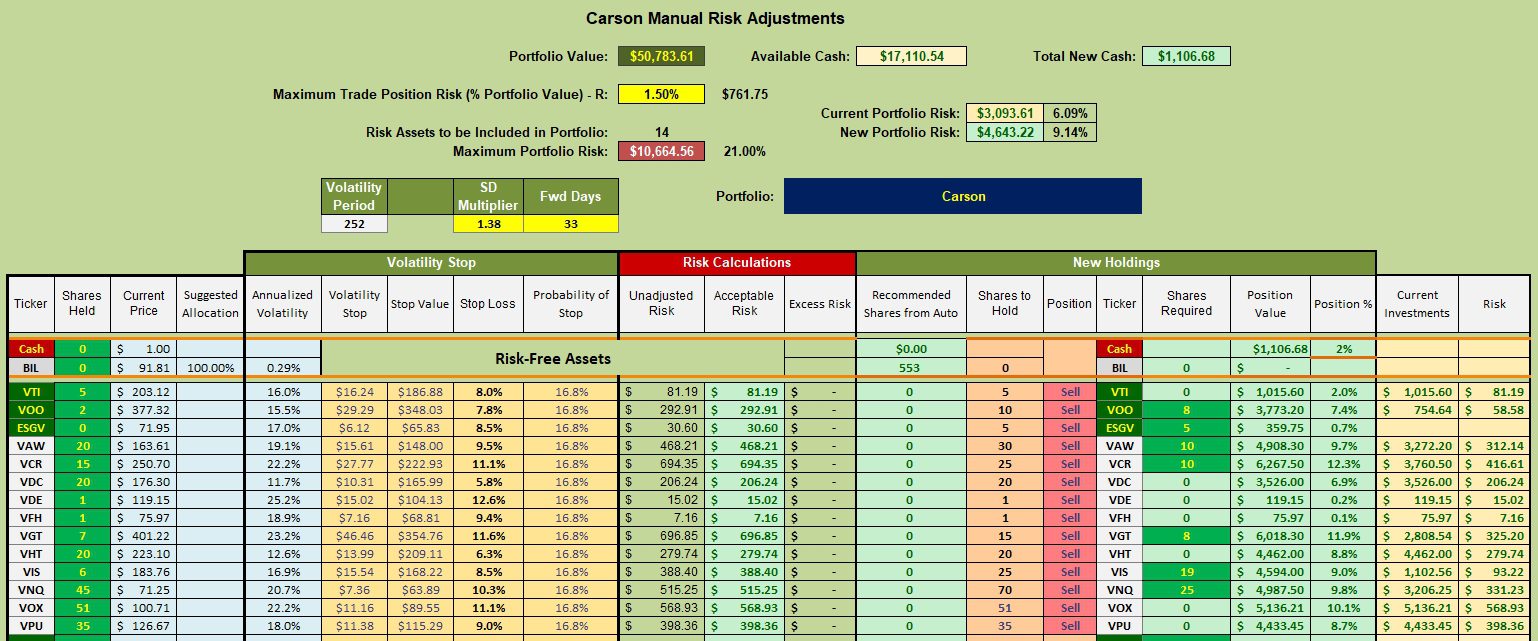
Carson Manual Risk Adjustments
No equity ETFs are currently recommended so we focus on the eleven (11) sectors as to where to invest and how many shares. The Kipling spreadsheet is used as a guide in determining how many shares of each sector ETF to purchase.
The shares selected under the Shares to Hold (8th from the right) will come close to the recommended percentages. For example, Materials (VAW) is to hold 9.1% of the portfolio. By recommending 30 shares the percentage will come to 9.7%.
When the market opens on Monday I will purchase shares in VAW, VCR, VGT, VIS, and VNQ. Remaining cash will be invested in VOO and ESGV. I use limit orders for these purchases.

Carson Performance Data
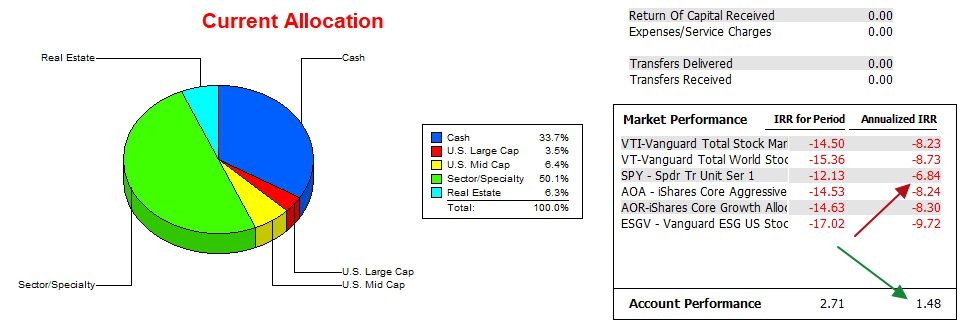
The following performance data runs from 12/31/2021 through 10/27/2023. The annualized IRR for the Carson is 1.5% whereas the S&P 500 (SPY) is negative 6.8% (-6.8%). The delta difference is not trivial. The 33% currently hold in cash will be put to work on Monday.
The 1.5% IRR value in this screenshot is lower than the 8.6% IRR value shown in the last screenshot. The reason is that in this slide the Carson held securities that did not perform as well as the 14 ETFs that currently make up the Carson portfolio. If this is confusing, post a question and I will try to explain further.

Carson Risk Ratios
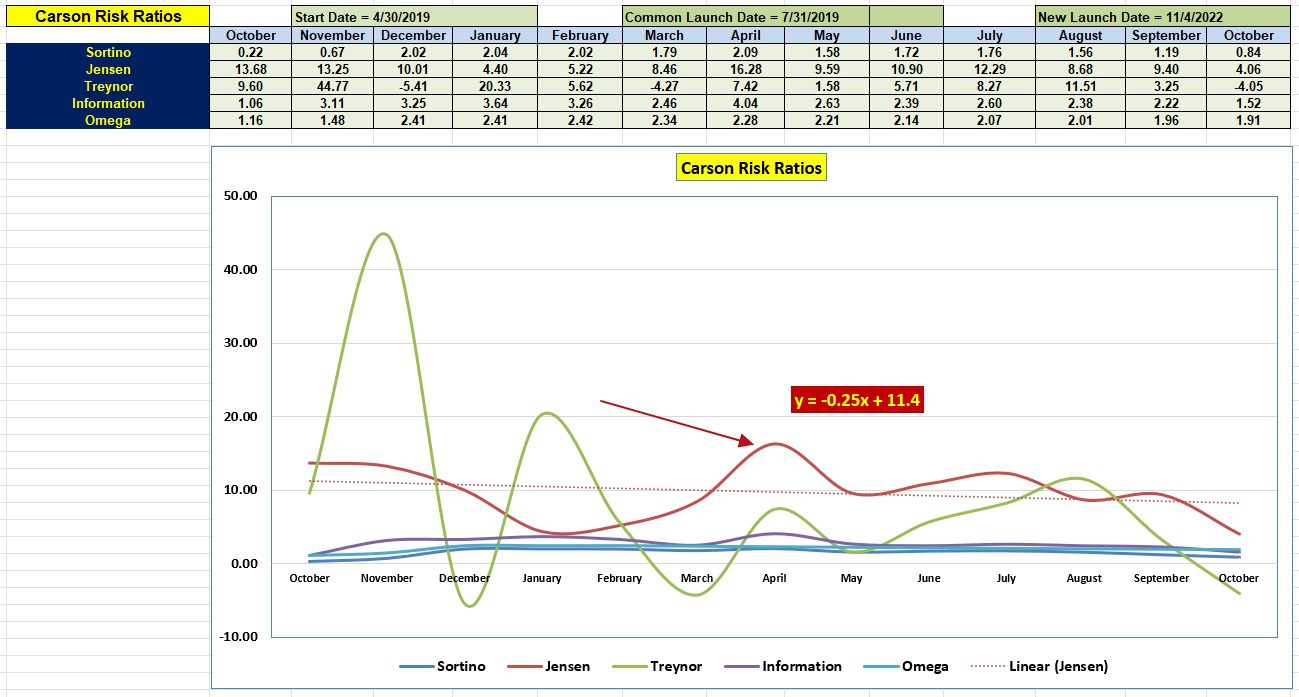
The following table provides portfolio risk information. The three most important values are Jensen Alpha, Information Ratio, and Sortino Ratio – in that order. I also pay considerable attention to the slope (-0.25) of the Jensen. Jensen Alpha is also known as the Jensen Performance Index. For more information on the Jensen, check out this link.

Carson Portfolio Report
As mentioned above, readers may be confused by the different IRR values. Below is something called the Portfolio Report. This table comes right out of the Investment Account Manager software. What I’ve done is to select the fourteen (14) securities that currently make up the Carson portfolio. Based on the Buy-Hold-Sell decisions over the past 22 months this portfolio generated an IRR of 8.6% while the SPY lost 6.8%.
Look over the table and check out the performance of the sector ETFs. Keep in mind that right now eight of the sectors are oversold and some were recently purchased. The red percentages in the far right column will turn black when the sectors eventually reach the overbought zone.
Based on the following data, the hypothesis upon which Sector BPI Plus portfolios are built looks quite encouraging.

Questions and Comments are always welcome.
Discover more from ITA Wealth Management
Subscribe to get the latest posts sent to your email.
You must be logged in to post a comment.