
Early morning coffee.
Yesterday I updated a Sector BPI portfolio. This morning it is time to examine an Asset Allocation portfolio. Pauling is a modest size portfolio built to handle securities all over the globe. The portfolio contains U.S. Equities, U.S. and International Bonds, Developed International Equities, Emerging Market Equities, Domestic and International Real Estate, and Treasuries.
The Pauling has been using the Asset Allocation investing model for a little over six months so we have little data to go on. However, this AA approach has a long history when it comes to portfolio construction. The Rutherford and Schrodinger portfolios are other examples where this model is used. One difference with the Pauling is that the goal is to never sell shares unless there is an emergency. This means the portfolio is very tax efficient.
Pauling Asset Allocation Setup
Below is the “investment quiver and investment arrows” for the Pauling. A few asset classes are out of balance. When new money is added to the portfolios, as happened recently, we keep adding shares to those asset classes that are below target. BND, VWO, VEA, and TLT are examples where we plan to add more shares.
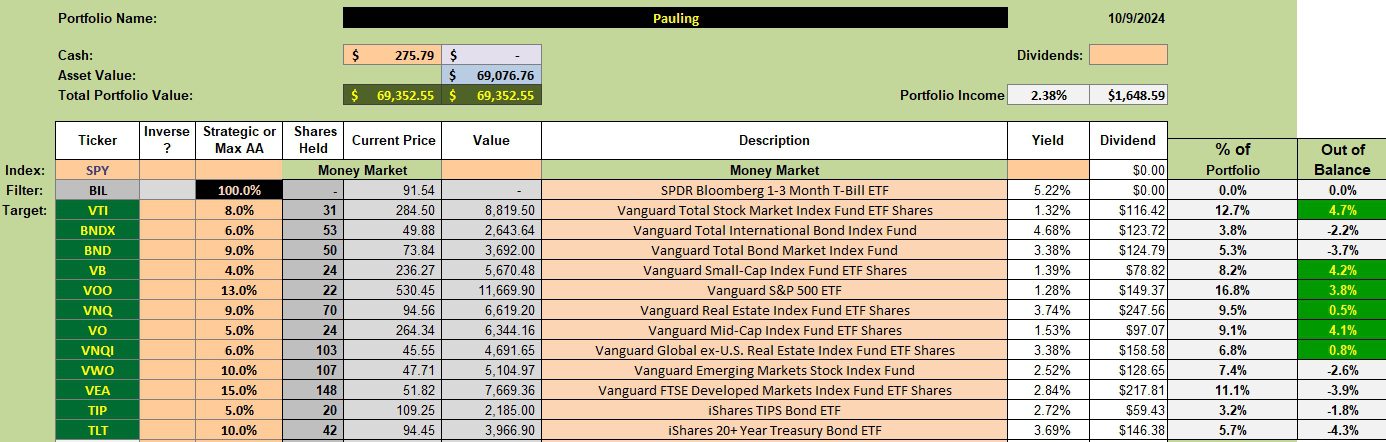
Pauling Rebalancing Recommendations
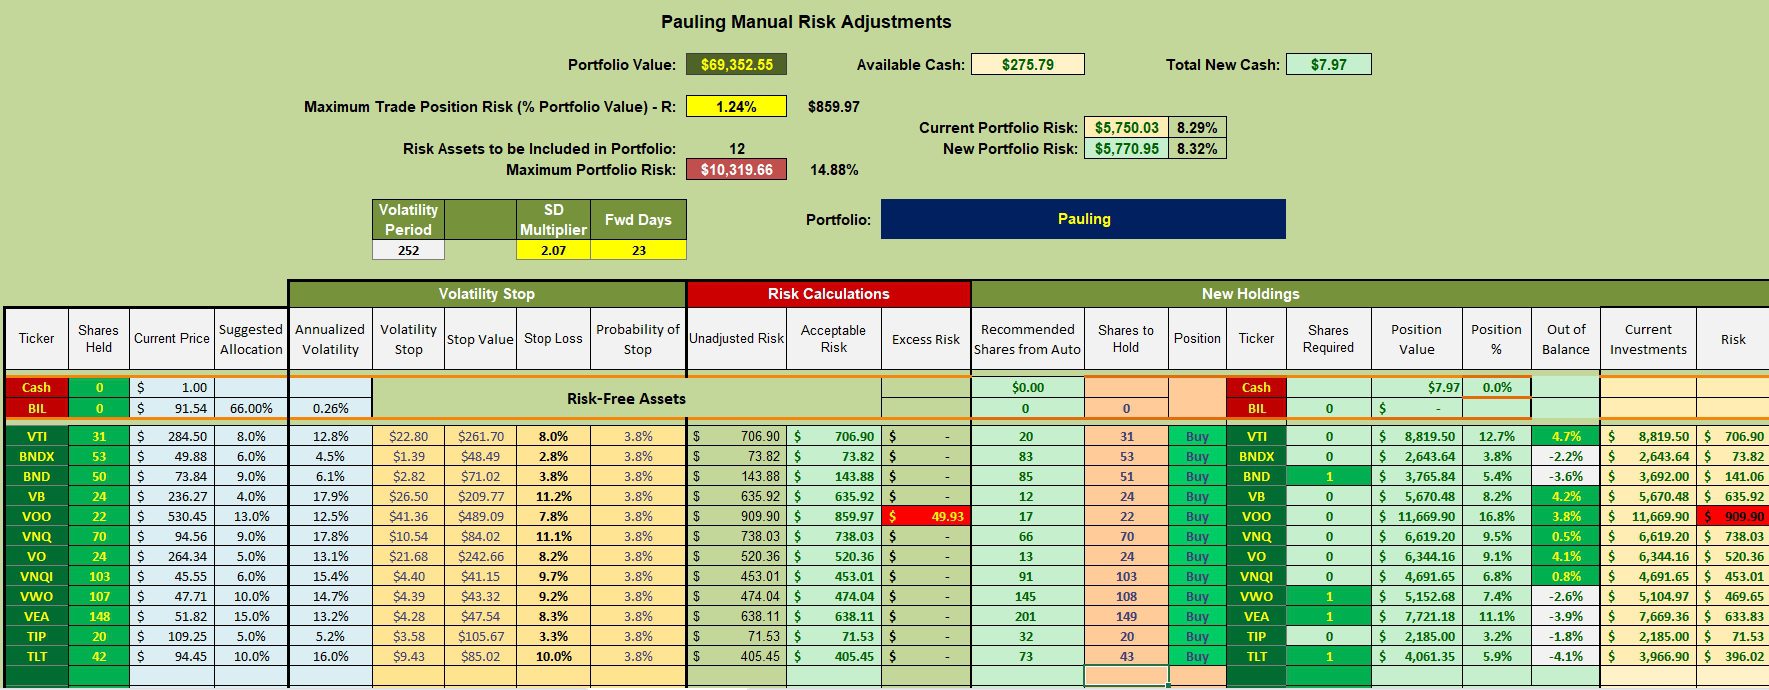
Limit orders are in place to add a share to each ETF, BND, VWO, VEA, and TLT.
Investors interested in the Asset Allocation approach could easily construct their own Excel™ spreadsheet and update prices once a month. Running the Kipling is not a must.
Pauling Performance Data
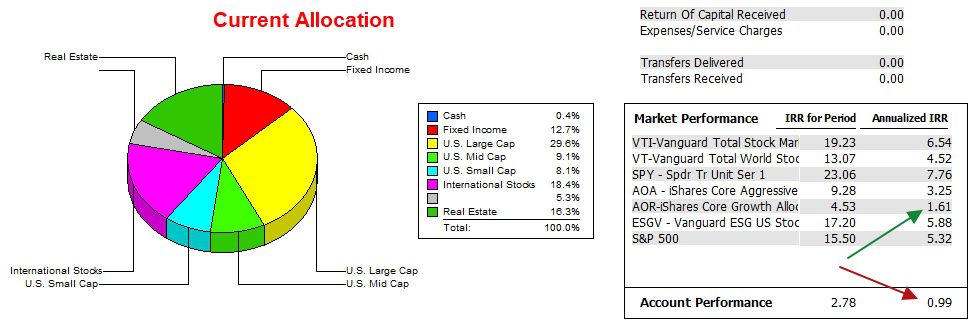
The following data comes from the commercial software, Investment Account Manager. Since 12/31/2021 the Pauling lags the SPY benchmark. In fact the Pauling lags all potential benchmarks.
The gray area of the pie chart most likely includes investments in TLT and TIP.
Pauling Risk Ratios
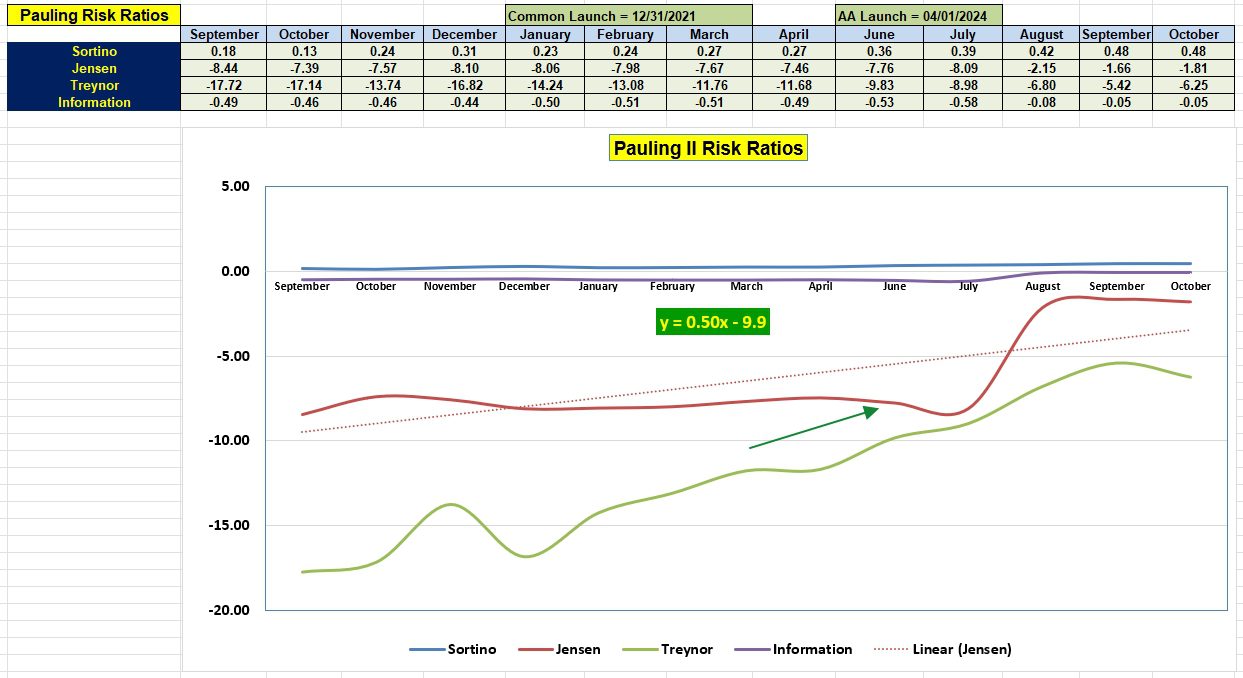
Since the Pauling is new to the Asset Allocation (AA) investing model we need to check on growth rather than the current IRR values. Over the last few months we have seen improvement in both the Jensen Alpha ratio and Information ratio. The Jensen did drop since September so we need to keep an eye on the slope of the Jensen as monthly data is posted.
Within the last few days the interest rate on the risk-free treasury (SHV) ticked up from 5.13% to 5.14%. While this had little impact on the value of the Jensen, the rate is trending in the wrong direction. We prefer a downward trend as that will aid the Jensen Alpha calculation.
Send the https://itawealth.com link to your friends and family if you think the information is useful.
Discover more from ITA Wealth Management
Subscribe to get the latest posts sent to your email.
Another comment related to ordinary income from investments and taxes. Many investors develop portfolios using stocks that are classified as “dividend champions” or some other name that indicates a dividend history that shows continuous growth in the dividend payout. The goal is to put together a portfolio where dividends cover living expenses. There is something psychological sound about a portfolio where shares do not need to be sold to cover living expenses.
The other option is to create a portfolio of growth stocks and to then sell shares and pay capital gain taxes on the sale. In this case one is living off the sale of stocks to live and pay a lower tax rate whereas the first method is to live off dividends and pay a higher tax rate. I posit most investors will opt for the first option.
Lowell