
Oregon Vineyard
“Millikan is a portfolio that focuses on Sector Bullish Percent Indicators. These indicators provide valuable insights into the bullish sentiment within specific sectors of the market. Understanding these indicators can help investors make informed decisions and effectively navigate the market. By analyzing the Sector Bullish Percent Indicators, investors can identify potential opportunities and gauge the overall health and direction of various sectors.”
The above paragraph was generated by an Artificial Intelligence source. While accurate, it is so general as to be nearly useless. Therefore, lets get into the specifics as to how the Sector BPI investing model works.
- The first activity is to check the BPI data for each of the eleven market sectors. Are there any sectors either overbought or oversold? Currently all sectors are either overbought or are resting in the neutral zone. The neutral zone is defined as bullish stock percentages residing between 30.1% bullish and 69.9% bullish. Energy recently toyed with moving into the overbought zone but now backed down to 63.63% bullish. Overbought is when the number of stocks within a sector reaches 70% (or higher) bullish. Discretionary and Staples are recent sectors that were sold out of the Sector BPI portfolios leaving Energy as the sole sector holding. All the Sector BPI portfolios hold shares in VTI and VOO.
- When a sector is overbought we set a 3% Trailing Stop Loss Order on the ETF representing that sector. When the BPI moves even higher we adjust the TSLO accordingly. When this occurs I will go into more detail of how I adjust the TSLO.
- When a sector is oversold we purchase sufficient shares in the “sector ETF” to reach the recommended percentage.
- If excess cash is in the money market we use that money to purchase shares of either VOO or VTI. Preference is given to VOO. Buying shares in VOO or VTI is a way to prevent falling behind should the broad stock market move up while we are not fully invested in sector ETFs.
Millikan Sector BPI Holdings
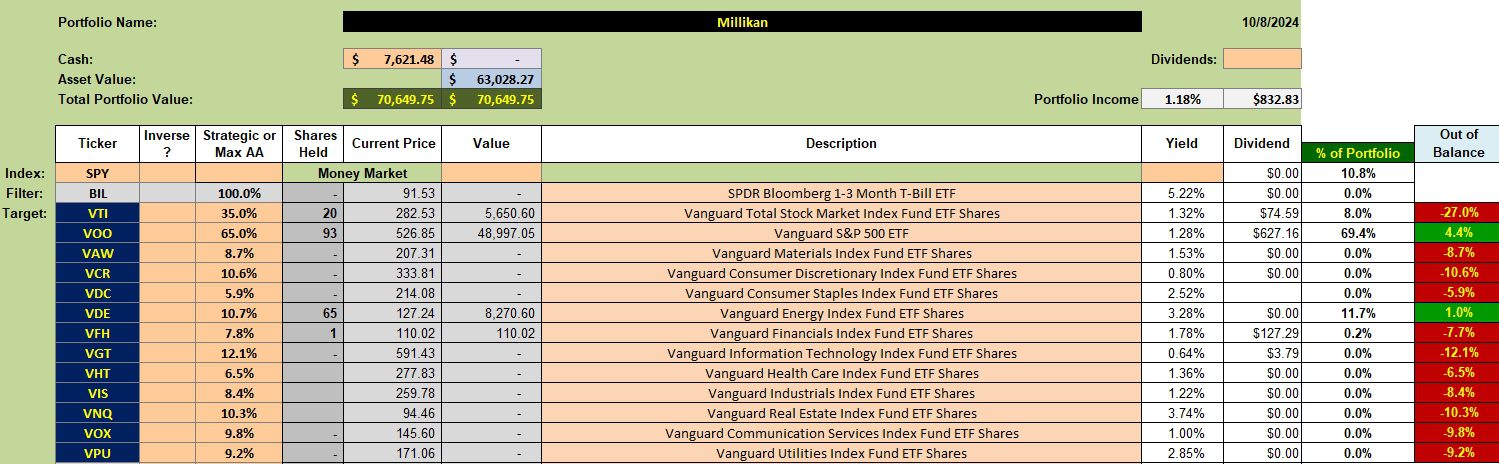
Shares of VTI and VOO were added to the Millikan yesterday as cash became available due to sales from VDC and VCR. This leaves Energy (VDE) as the primary sector remaining in the portfolio. That lone share of VFH is a shard holding and I have a TSLO set to sell it.
Limit orders to pick up more shares of VTI and VOO are set to use up the remaining $7,600 in cash. Limit orders are set very close to the current price.
Millikan Performance Data
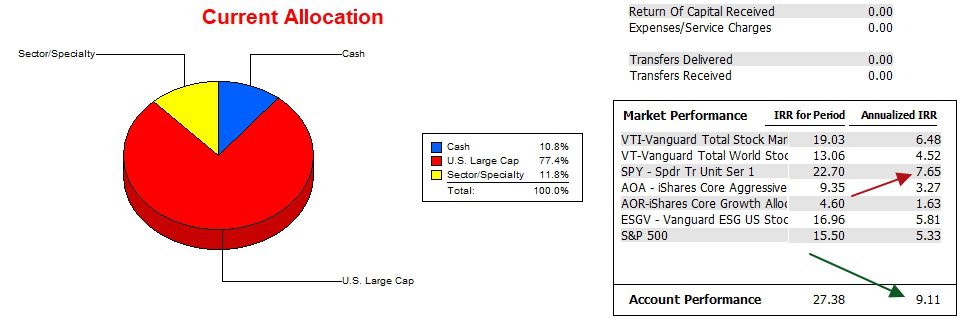
Since 12/31/2021 the Millikan holds a lead on the SPY benchmark. Note that the SPY ETF is generating a better return than the actual S&P 500 index. Thus far the Sector BPI investing model is working as anticipated. However, it is still too early to draw conclusions so I consider the Sector BPI model to still be in the hypothesis stage of development. It is important to remain invested in VOO and VTI when sectors are out of favor. We don’t want the market walking away to the upside while we remain in cash.
The Millikan performance is well above other potential benchmarks such as VTI, VT, AOA, and AOR.
Millikan Risk Ratios
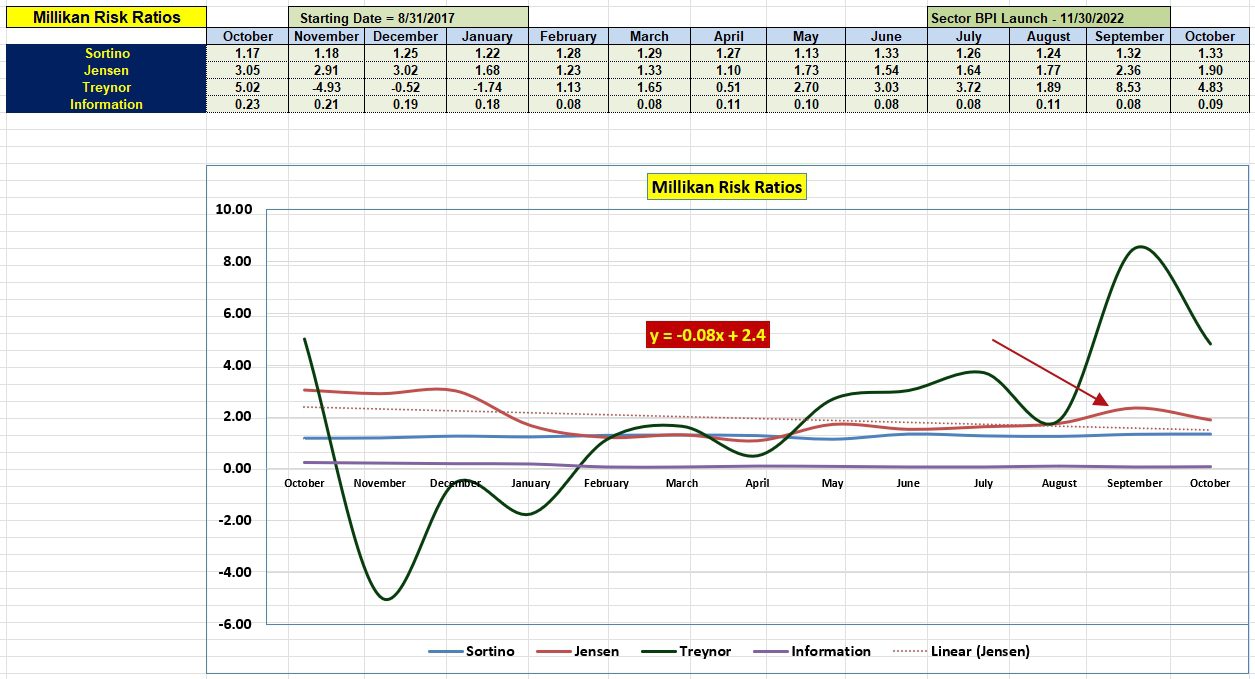
As the Millikan moves toward full investment in equities the risk increases. We see this in the Jensen Alpha value which dropped in October compared to this past September. The Information Ratio ticked up, but is still well below where it was last year at this time. We need to remember that 2023 was an excellent year for U.S. Equities.
Tomorrow I will update the Pauling, one of several Asset Allocation portfolios.
As a review, there are several investing models presented here at ITA.
- Hedgehunter reports on the Rutherford and several other portfolios.
- The Copernicus invests strictly in U.S. Equities so is considered a “high” risk portfolio. It also has the best IRR value.
- The Schrodinger is an Asset Allocation style portfolio, but is different in that it is managed by a computer. Schrodinger is the definition of a passively managed portfolio. The Schrodinger is of sufficient size for Schwab to tax manage this portfolio.
- Numerous ITA portfolios follow the Asset Allocation model. As currently managed, these are all tax efficient portfolios.
- Portfolios requiring the most work to manage are the Sector BPI portfolios such as the Millikan presented above.
In general, I moved portfolios to management styles that reduce taxes. Due to buying and selling sector ETFs, the Sector BPI portfolios are likely to be the least tax efficient.
Some years ago I did a “back-of-envelop” calculation and figured one needs to outperform the benchmark by 2 percentage points to offset taxes. Therefore, manage your portfolio(s) so as to reduce taxes.
Discover more from ITA Wealth Management
Subscribe to get the latest posts sent to your email.
To be tax advantageous, per your “Back of the envelope,” one would need to beat a benchmark +2% ? What an interesting formulation. Beating SPY +2% is a tall order. When convenient, I sure many, like me, would appreciate more on this topic.
Lee,
Here is one site I found that might be useful. I’ll look for other examples. Other readers do the same as this is a useful topic.
https://www.youtube.com/watch?v=vOBwxRvCHa8
In the last example where the couple sold their house, the advisor did not take into account the $500,000 one time exemption. If the house sold for $600,000 and there were $50,000 of improvements the capital gains on the house come to $50,000. These are USA tax examples and may differ in Canada or other countries.
Lowell
Lee et al.,
Suppose one has investment earnings of $25,000 per year. Now assume the entire earnings come from ordinary income that is taxed at 28%. One will pay $7,000 in taxes on this income.
Now assume the $25,000 income is from capital gains where the tax rate is 15%. Taxes now amount to $3,750. That is a huge difference.
The current yield percentage for VOO is 1.28%. If one invests strictly in VOO (similar to the Copernicus portfolio) and uses TSLOs to protect capital, one is likely to be further ahead both on returns and taxes.
Lowell