
California Orchard
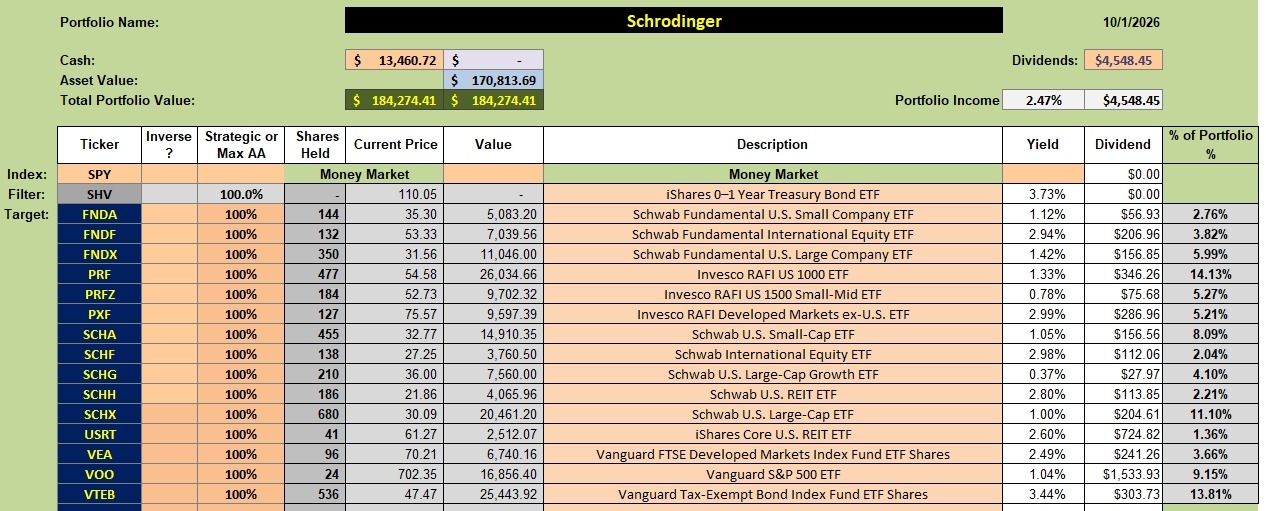
Selling shares within the Schrodinger is so rare it merits taking notice. Recently, the Schwab computers sold shares of Invesco US 1000 (PRF) and Schwab Municipal Bond (SCMB) and used the cash to purchase shares of Vanguard Tax Exempt Bond (VTEB). This move eliminated holding shares in SCMB.
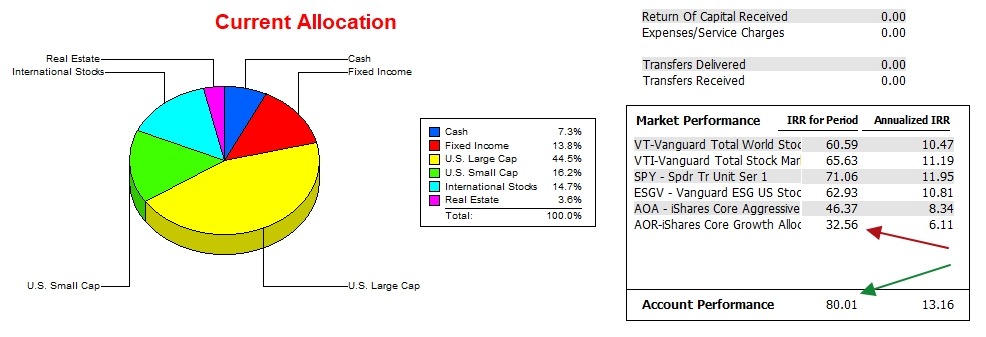
For new readers, the Schrodinger is a Robo Advisor portfolio managed by computers at Schwab. The management cost is free and this includes transaction fees. The primary disadvantage to a Schwab “Intelligent Portfolio” is that this passive portfolio holds a significant percentage (currently 7.3%) in cash. In a down market this cash is an advantage. In an up market it is a minor drag.
I launched the Schrodinger on 7/31/2017 so there is now over nine years of information. I use 12/31/2021 as the launch date as that is when the youngest ITA portfolio was launched. So I can compare performance between the different investing models I needed a common starting data and 12/31/2021 is that date.
Schrodinger Asset Allocation Model
Below is the current asset allocation for the Schrodinger portfolio. I do nothing with this portfolio other than account for the cash the portfolio owner adds each month. This portfolio was set up to answer the question, “Who will manage the family portfolio when my spouse dies?” A Schwab “Intelligent Portfolio” answers this question.
I should add that the Schrodinger is “tax managed” as the account exceeds the $50,000 limit.
Schrodinger Performance Data
Since 12/31/2021 the Schrodinger has outperformed all benchmarks I am tracking. This includes the S&P 500 (SPY).
If I go back to 07/31/2017 the Schrodinger has an Internal Rate of Return of 13.02% while the S&P 500 (SPY) over that nine-year period generated an outstanding 14.85%.
Schrodinger Risk Ratio
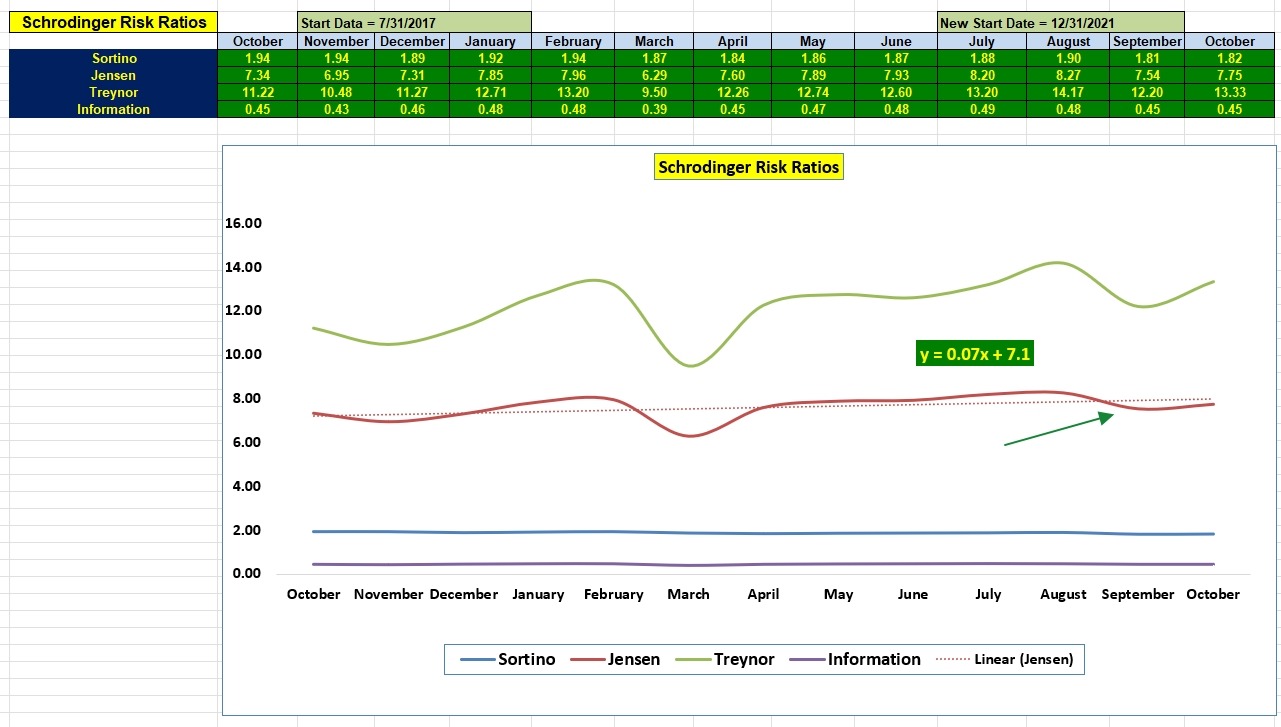
In addition to the Internal Rate of Return, I am interested in how different portfolios perform when risk is taking into account. Below are four metrics. Of the four, the Jensen Alpha or Jensen Performance Index is the most important as it takes into account four different data points.
Over this past year the following data shows consistency. There is little change in the two most important risk metrics and they are: Jensen Alpha and Information Ratio. The slope of the Jensen is a slight positive at 0.07. Any investor would be pleased with this performance record, knowing that one does nothing except add cash to the account when available.
Discover more from ITA Wealth Management
Subscribe to get the latest posts sent to your email.
Leave a Comment or Question