
South-East London Skyline from Greenwich
Over the past 18 months I have not had the time to decide how to manage the money that has been sitting in the Dirac Portfolio. This was to be a re-build portfolio project based on using an “Income” model, similar to the Hawking Portfolio, but designed to adopt a mean reversion rather than momentum strategy to select candidate funds to hold in the portfolio. However, when I started to build this portfolio, the markets were bullish and there were few funds with negative Z-Scores (indicating an oversold situation) so I did little investing and most of the funds were left in T-Bills (BIL).
In addition, the funds were held in a Canadian Tax-Free Savings Account (similar to a Roth IRA) that would normally mean that I didn’t have to worry about paying tax on distributions (anticipated at ~12% per year) paid from the Funds (primarily Closed-End-Funds). However, this does not apply to distributions made from US Funds where I am subject to a 15% US withholding tax. Now, while I don’t have a problem investing in US companies, it does not make sense for me to hold funds in a supposedly Tax-Free account and yet have to give up a portion of the profits to the IRA – basically a US inflicted tariff on my US investments😊.
I have therefore decided to split the account into 2 separate accounts in which I will hold CEFs (or Canadian equivalents) trading on the Toronto Stock Exchange (TSX) and paying similarly high ~8-12% yields (tax-free), in one account and more conventional Funds, trading on US exchanges, with smaller, if any, “income” distributions, but relying on “growth” to generate (tax-free) profits, in the other account. Since readers of this blog are not likely to be interested in Funds trading on the TSX I shall therefore only focus on the account trading Funds bought and sold on US exchanges as I start again to rebuild the Dirac portfolio. I will also be reverting to my “momentum” strategies/models to manage this portfolio going forward.
The objective for this account/portfolio will be to see if I can beat the performance of the S&P 500 – at least in terms of reward/risk (as will be determined by the Sharpe ratio). As regular readers of this blog will know, it is not easy to beat the performance of an index fund, so I expect this to be an uphill battle.
My Plan is to adopt the strategies employed in the Rutherford-Darwin Portfolio but to focus wholly on the US equity markets and to break this down into the eleven major sectors that comprise the S&P 500. To the extent possible (there are regulatory restrictions for these tax-free accounts) I will use Options to help manage risk and, possibly, generate “alpha” and I will start out by selecting from the eleven iShares (SPDR) ETFs that represent stocks in the S&P 500:
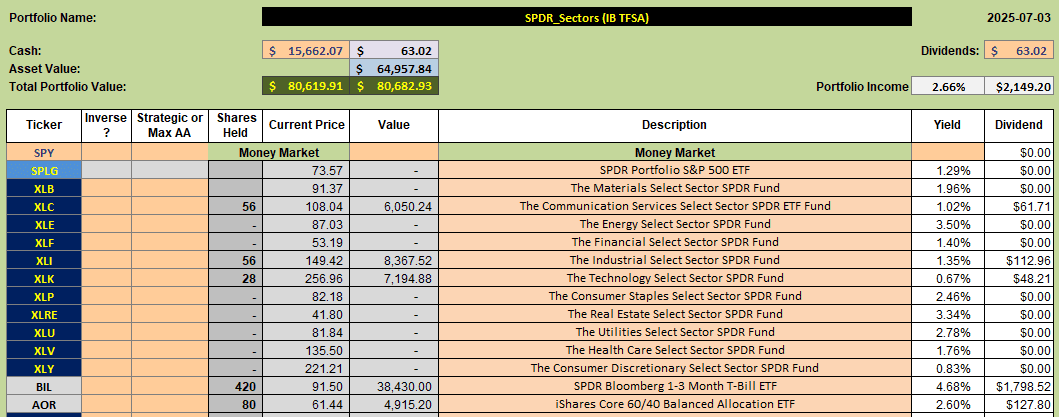
After transferring ~$79,500 (in shares and Cash) to the new account on June 10, I am left with the holdings shown in the above screenshot. Approximately 25% of this is currently held in shares of three sector ETFs, XLC (Communications), XLI (Industrials) and XLK (Technology) with much of the balance in T-Bills or Cash.
Checking the current Rankings and Recommendations from the Kipling workbook we see the following picture:
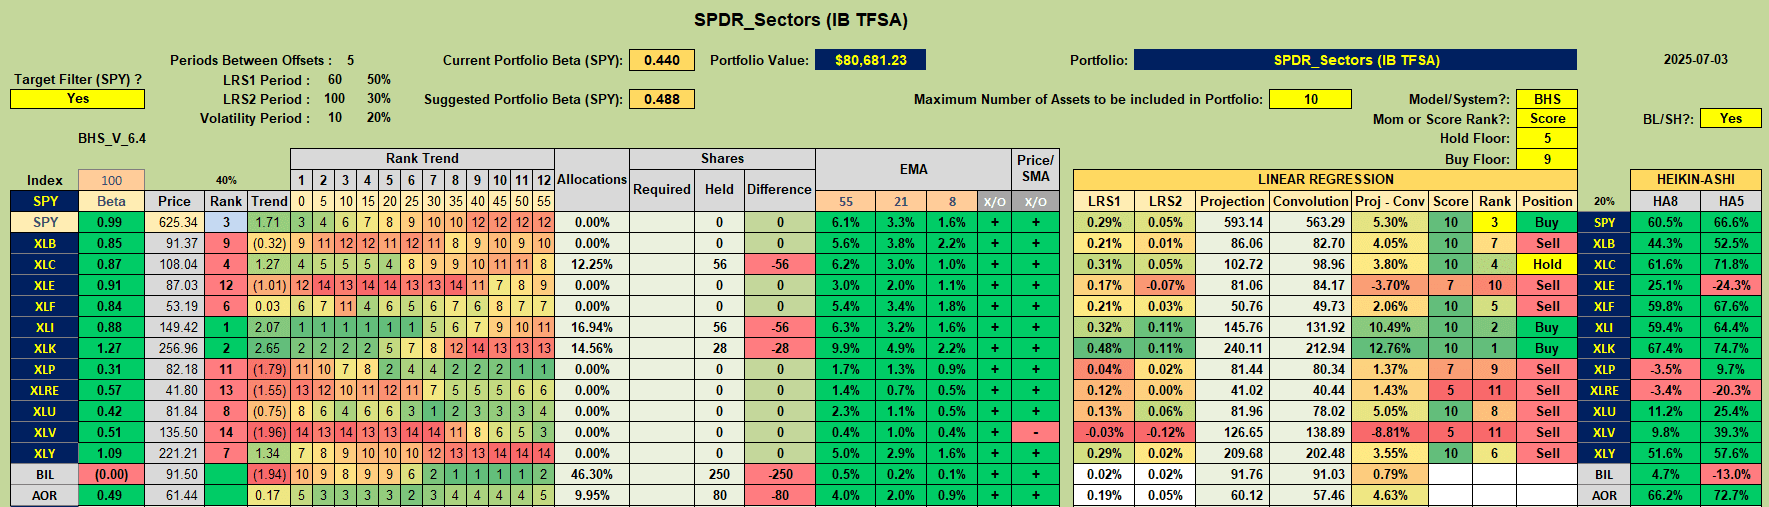
Where, requiring ETFs to be ranked higher than the benchmark SPY Fund for inclusion in the portfolio, we see Buy recommendations for XLI and XLK and a Hold recommendation for XLC.
Trades in the account from the transfer on June 10 to July 3 are shown below:
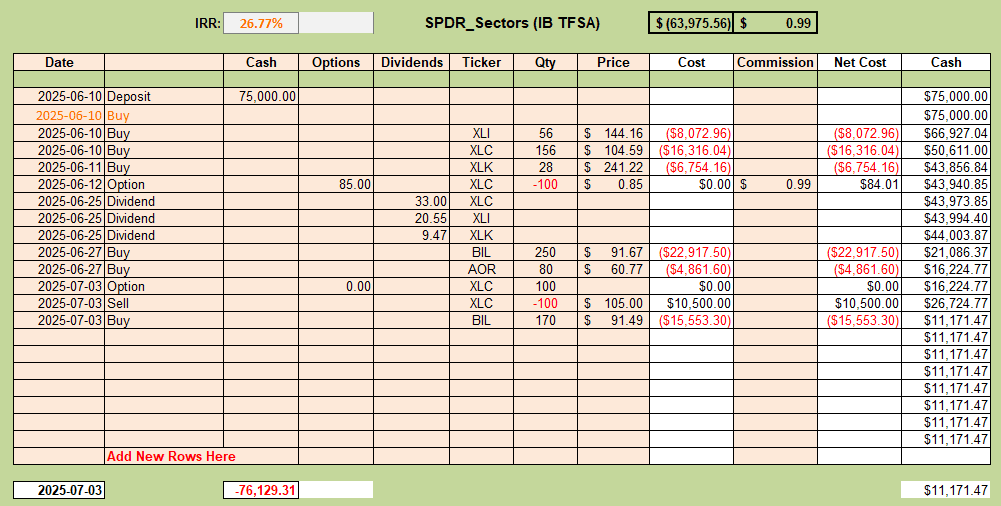
Where $75,000 is available for investment in the sector ETFs and the $4,500 balance is set aside for risk management and the possible purchase or sale of Options for hedging/insurance purposes.
To date, only one Call Option was sold against 156 shares of XLC and this was allowed to expire, In-The-Money (ITM), on July 3, enabling me to keep the $85 received for the Call Option but giving up 100 of the shares held at $105/share and reducing holdings to 56 shares. This is ok since I was slightly over-subscribed to XLC and can easily rebalance, if appropriate, from here:
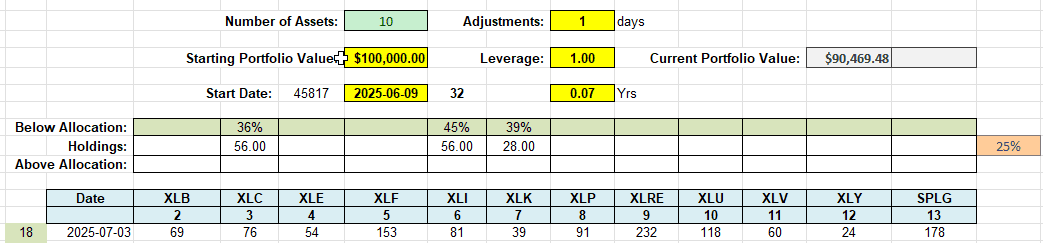
As for the Rutherford-Darwin Portfolio I am using a 2% volatility target per ETF to calculate the share allocations. I am presently ~40% under-subscribed to the 3 ETFs held in the portfolio.
My decision, at this point, is whether, or not, to relax the requirement that a sector ETF should outrank the benchmark ETF (SPY). Should I choose to do this, I get the following recommendations from the Kipling workbook:
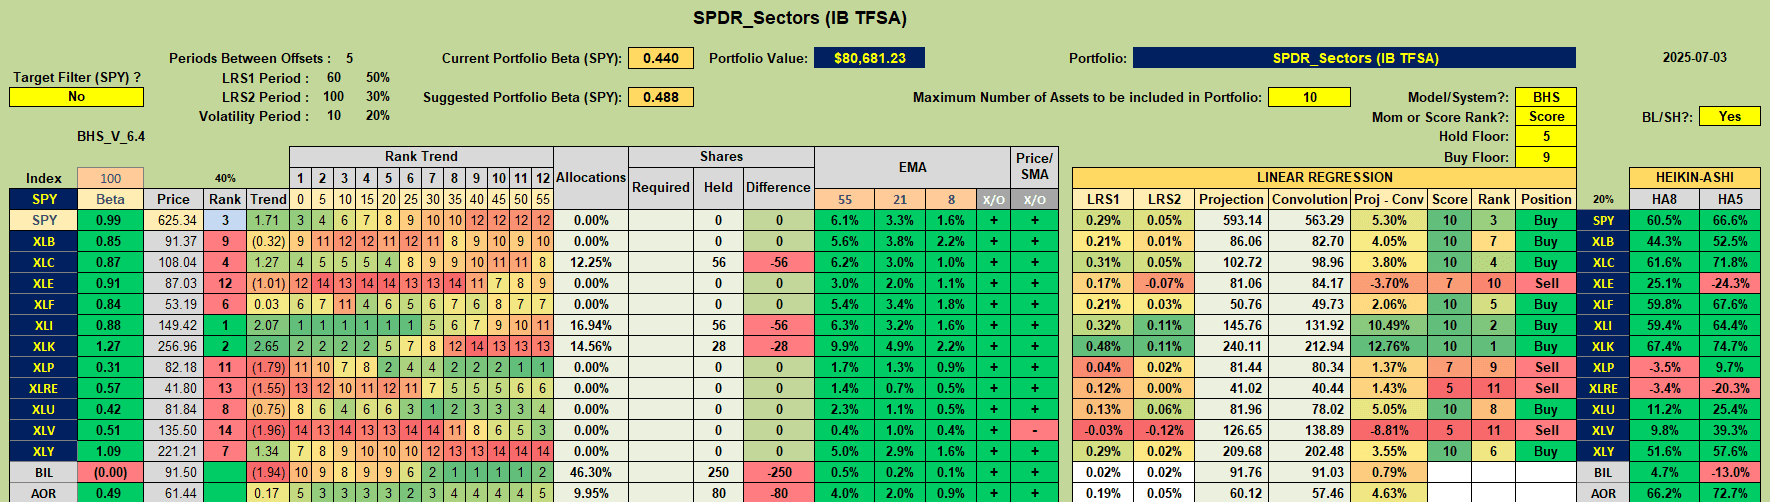
where we see that XLB (Materials), XLF (Financials), XLU (Utilities) and XLY (Consumer Discretionary) are added to the “Buy” List.
A dilemma arises here as to whether it may be better to “play it a little safe” and wait for confirmation that the sector is outperforming the benchmark/index or whether this might result in lost opportunities and whether it might be better to be more aggressive, take more risk, and go “bottom fishing” to look for a lower entry on possible new strength.
Let’s take a look at the charts:
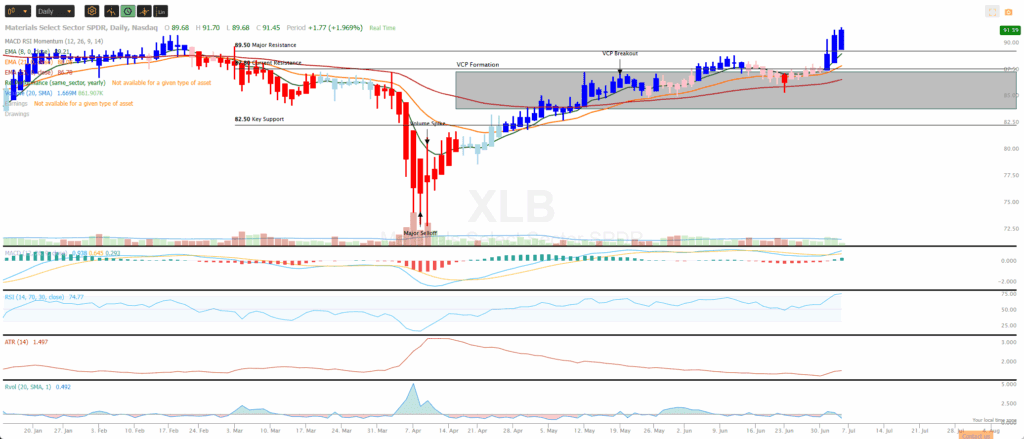
XLB has just broken out above major resistance with EMAs favorably aligned and bullish confirmation signals from the MACD and RSI Indicators – a definite “maybe” choice.
XLF is showing the same pattern – so another definite “maybe”:

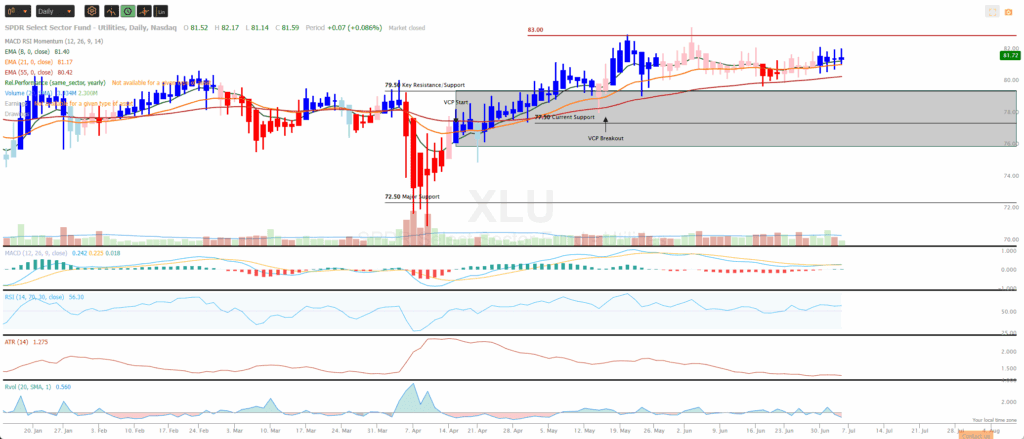
What about XLU? This one is not looking quite as good since, although the technical indicators are looking OK and momentum is positive, we don’t see a recent breakout – when we know the benchmark/index is very bullish – therefore, in terms of relative strength, this ETF may not be able to outperform the index – although it was the first to break to new highs in May:
 and finally, XLY:
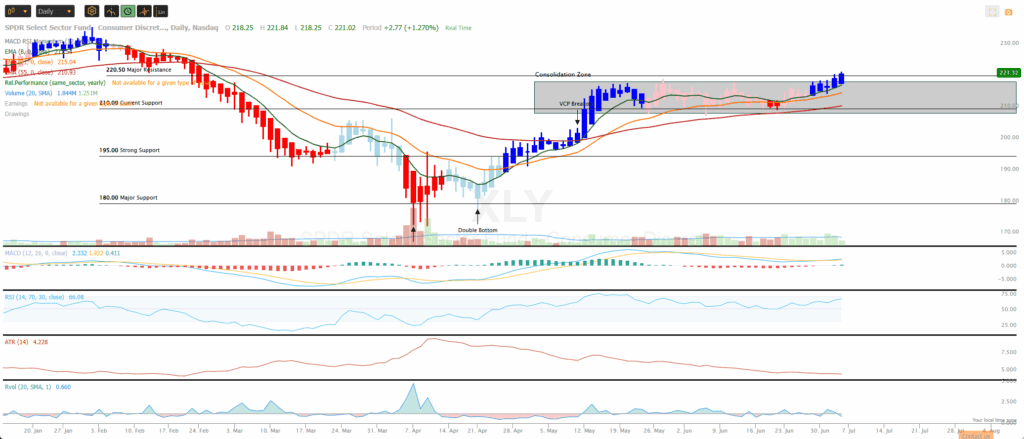
Here, our confirmatory indicators are all favorable and we have a breakout above the consolidation zone – but we are not making new all-time highs – so, in terms of relative strength, can this ETF outperform the wider index?
Is there another way to look at relative performance?
Let’s look at the ratio of sector price to index price:
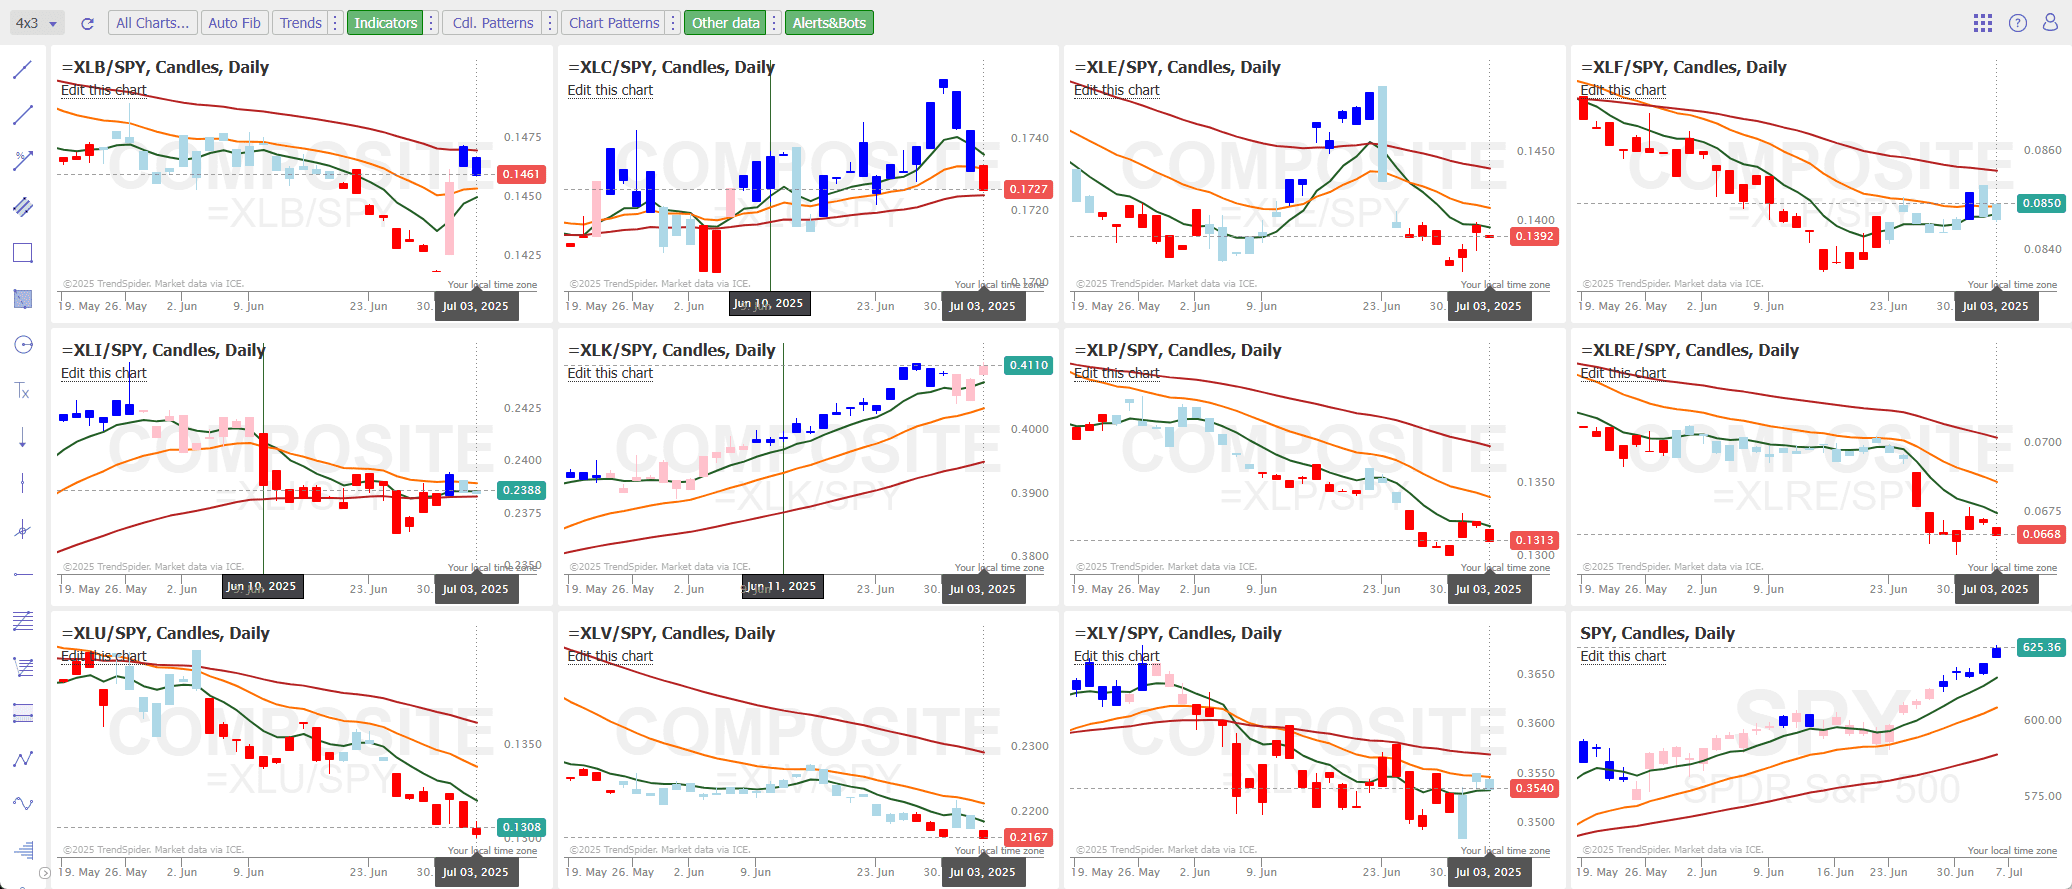
When the EMA lines are moving upwards (bottom left to upper right) and are stacked with shorter term averages above longer term averages we know that the sector is beating the index. This is most obvious for XLK (Technology) that has been the leading contributor to the performance of the S&P 500. XLC is also obviously strong – even if not quite as impressive as XLF. XLI was doing well until recently when it weakened a little and is now traveling sideways (keeping up with the benchmark) but with the 8-period EMA now dropping below the 21-period EMA (maybe an early warning sign). Of course, this is all relative and most sectors are still in bullish territory – just not all are as bullish as the total market as represented by SPY – our benchmark comparative fund.
The dangers of going “bottom fishing” can be seen in the plot of XLE/SPY (3rd chart on top row of above screenshot) where we saw a strong bullish crossing of EMAs a few weeks ago, with prices closing above all these averages, only to see a “flash” 10%+ drop on June 23 ….. but this is investment/trading and we may be seeing a recovery from here.
Ok – so what am I going to do from here?
I will look to add a position in XLF to the portfolio to test the waters as to whether it is worth trying to enter positions before there is confirmation that the sector is outperforming the broader market. If this turns out to show good results then candidates like XLB and XLY will be considered more seriously as we build experience.
in addition, I will also open a position in SPLG (a proxy for the SPY benchmark) since the broader market itself is presently strong. SPLG is strongly correlated with SPY but trades at a lower price than SPY – so this will enable me to purchase more shares and, maybe, provide me with the opportunity to sell Call Options against holdings.
Risk Management
If I am to outperform the broad market (on a risk-adjusted basis) then I will need to manage risk effectively and to try to add a little “alpha” through the sale of Call Options and the effective hedging of long positions.
At the present time, the portfolio looks like this:
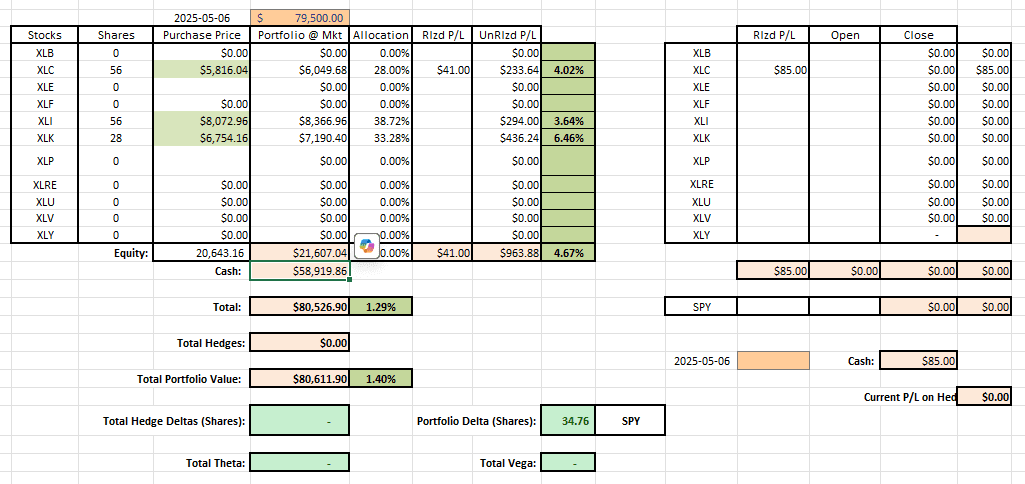
With no active hedges.
As mentioned at the beginning of this post, Funds in this portfolio are held in a tax-free retirement account (similar to a Roth IRA) and this limits strategies that I can use to hedge and generate “alpha”. I am only allowed to Sell Call Options against shares held in the account – and I need to hold 100 shares in order to sell one Call contract. As can be seen by looking at the allocation table (4th screenshot from the top) this may not always be possible. I can also buy Put Options for downside protection – but this results in a debit to the account (the cost of insurance) and I would like to be able to finance those purchases from the credits received from the Sale of Call Options. Regulations do not allow me to Sell (for credits) Put Options in this account.
Graphically, performance to date looks like this:

With 3.34% (very low) volatility/risk.
Possible strategy changes going forward
As mentioned above, I plan to sell Call Options to generate credits – but the premiums on some of these broad sector ETFs are not high. Premiums are based on volatility and the following table shows the volatility of the sector ETFs and a comparison with the volatility of the broader market (SPY):
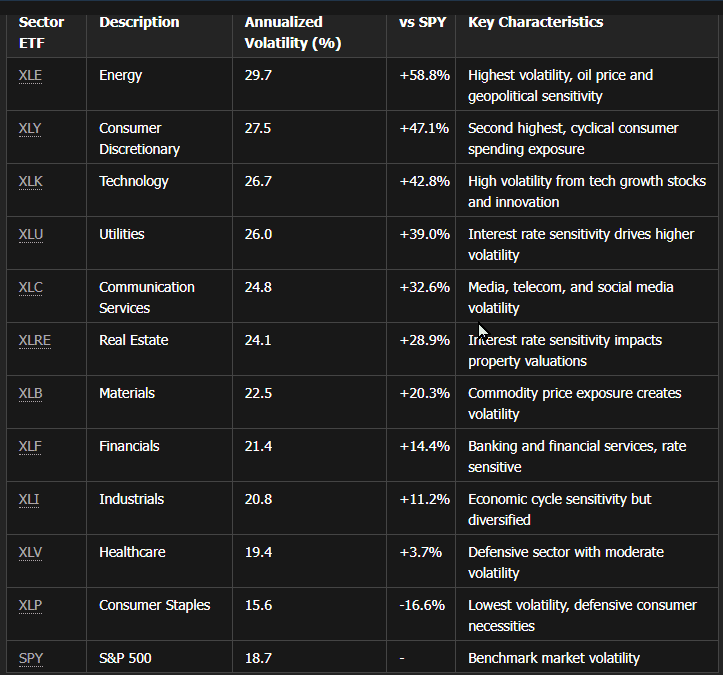
If I am not generating sufficient credits to finance the purchase of Put Options (for insurance) then, at some point, I might consider looking at the best performing stocks in a specific sector and consider buying shares in single stocks where volatility (and hence Option premiums) are much higher as a result of providing no diversity. But this is a way down the road and I’ll keep things as straightforward as possible until we see how things work out.
I will update this post in the next few days if/when I make adjustments.
Discover more from ITA Wealth Management
Subscribe to get the latest posts sent to your email.
This morning 150 shares of XLF (Financial Sector ETF) were added to this portfolio at $53.15 per share. If necessary, and attractive enough, I will be able to sell 1 Call Option against this holding to generate a credit.