
Spring Columbine
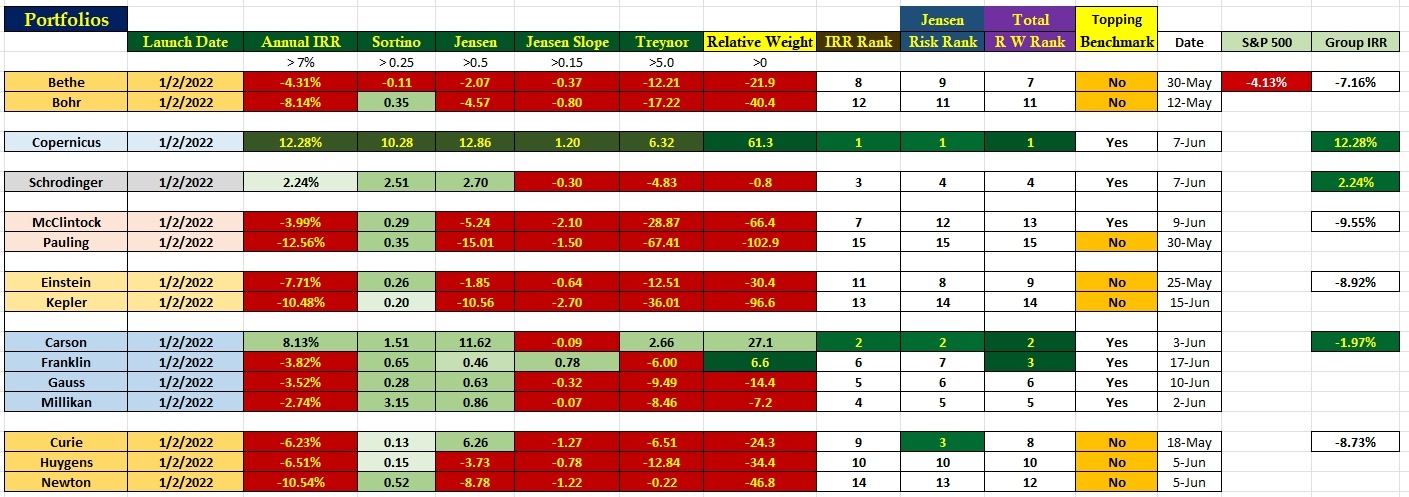
The following table includes ITA portfolio performance data as of June 16th. Since the last update the portfolios have shown improved IRR values, while the S&P 500 took an even larger leap forward. I’ll point out a few things to keep in mind as you look over the following table. For starters, one important factor is to see how strong the Schrodinger portfolio is performing. Only the Copernicus and Carson have higher Internal Rate of Return (IRR) values. In addition the Schrodinger ranks #4 when portfolio risk is taken into account.
Portfolio Performance Comparison Data
The IRR data (third column from the left) is accurate as of June 16th. The Sortino, Jensen Alpha, Jensen Slope, and Treynor values are only accurate as of the date publish in the third column from the right.
In the far right column I show the IRR values for the different investing model groups. The Copernicus and Schrodinger are groups by themselves as each is using a different investing model. As a group the Sector BPI Plus portfolios (Carson, Franklin, Gauss, and Millikan) are next in line when it comes to performance.
As a group the poorest performers are the Dual Momentum™ portfolios (McClintock and Pauling) and this pair is pulled down by the worst performer, the Pauling.
I likely will not post another performance table until sometime in the third quarter as I want to include all second quarter dividends in the next performance post.
ITA Portfolios: Summarizing Investing Approaches
Portfolio Management In A Volatile and Bearish Market
Discover more from ITA Wealth Management
Subscribe to get the latest posts sent to your email.
You must be logged in to post a comment.