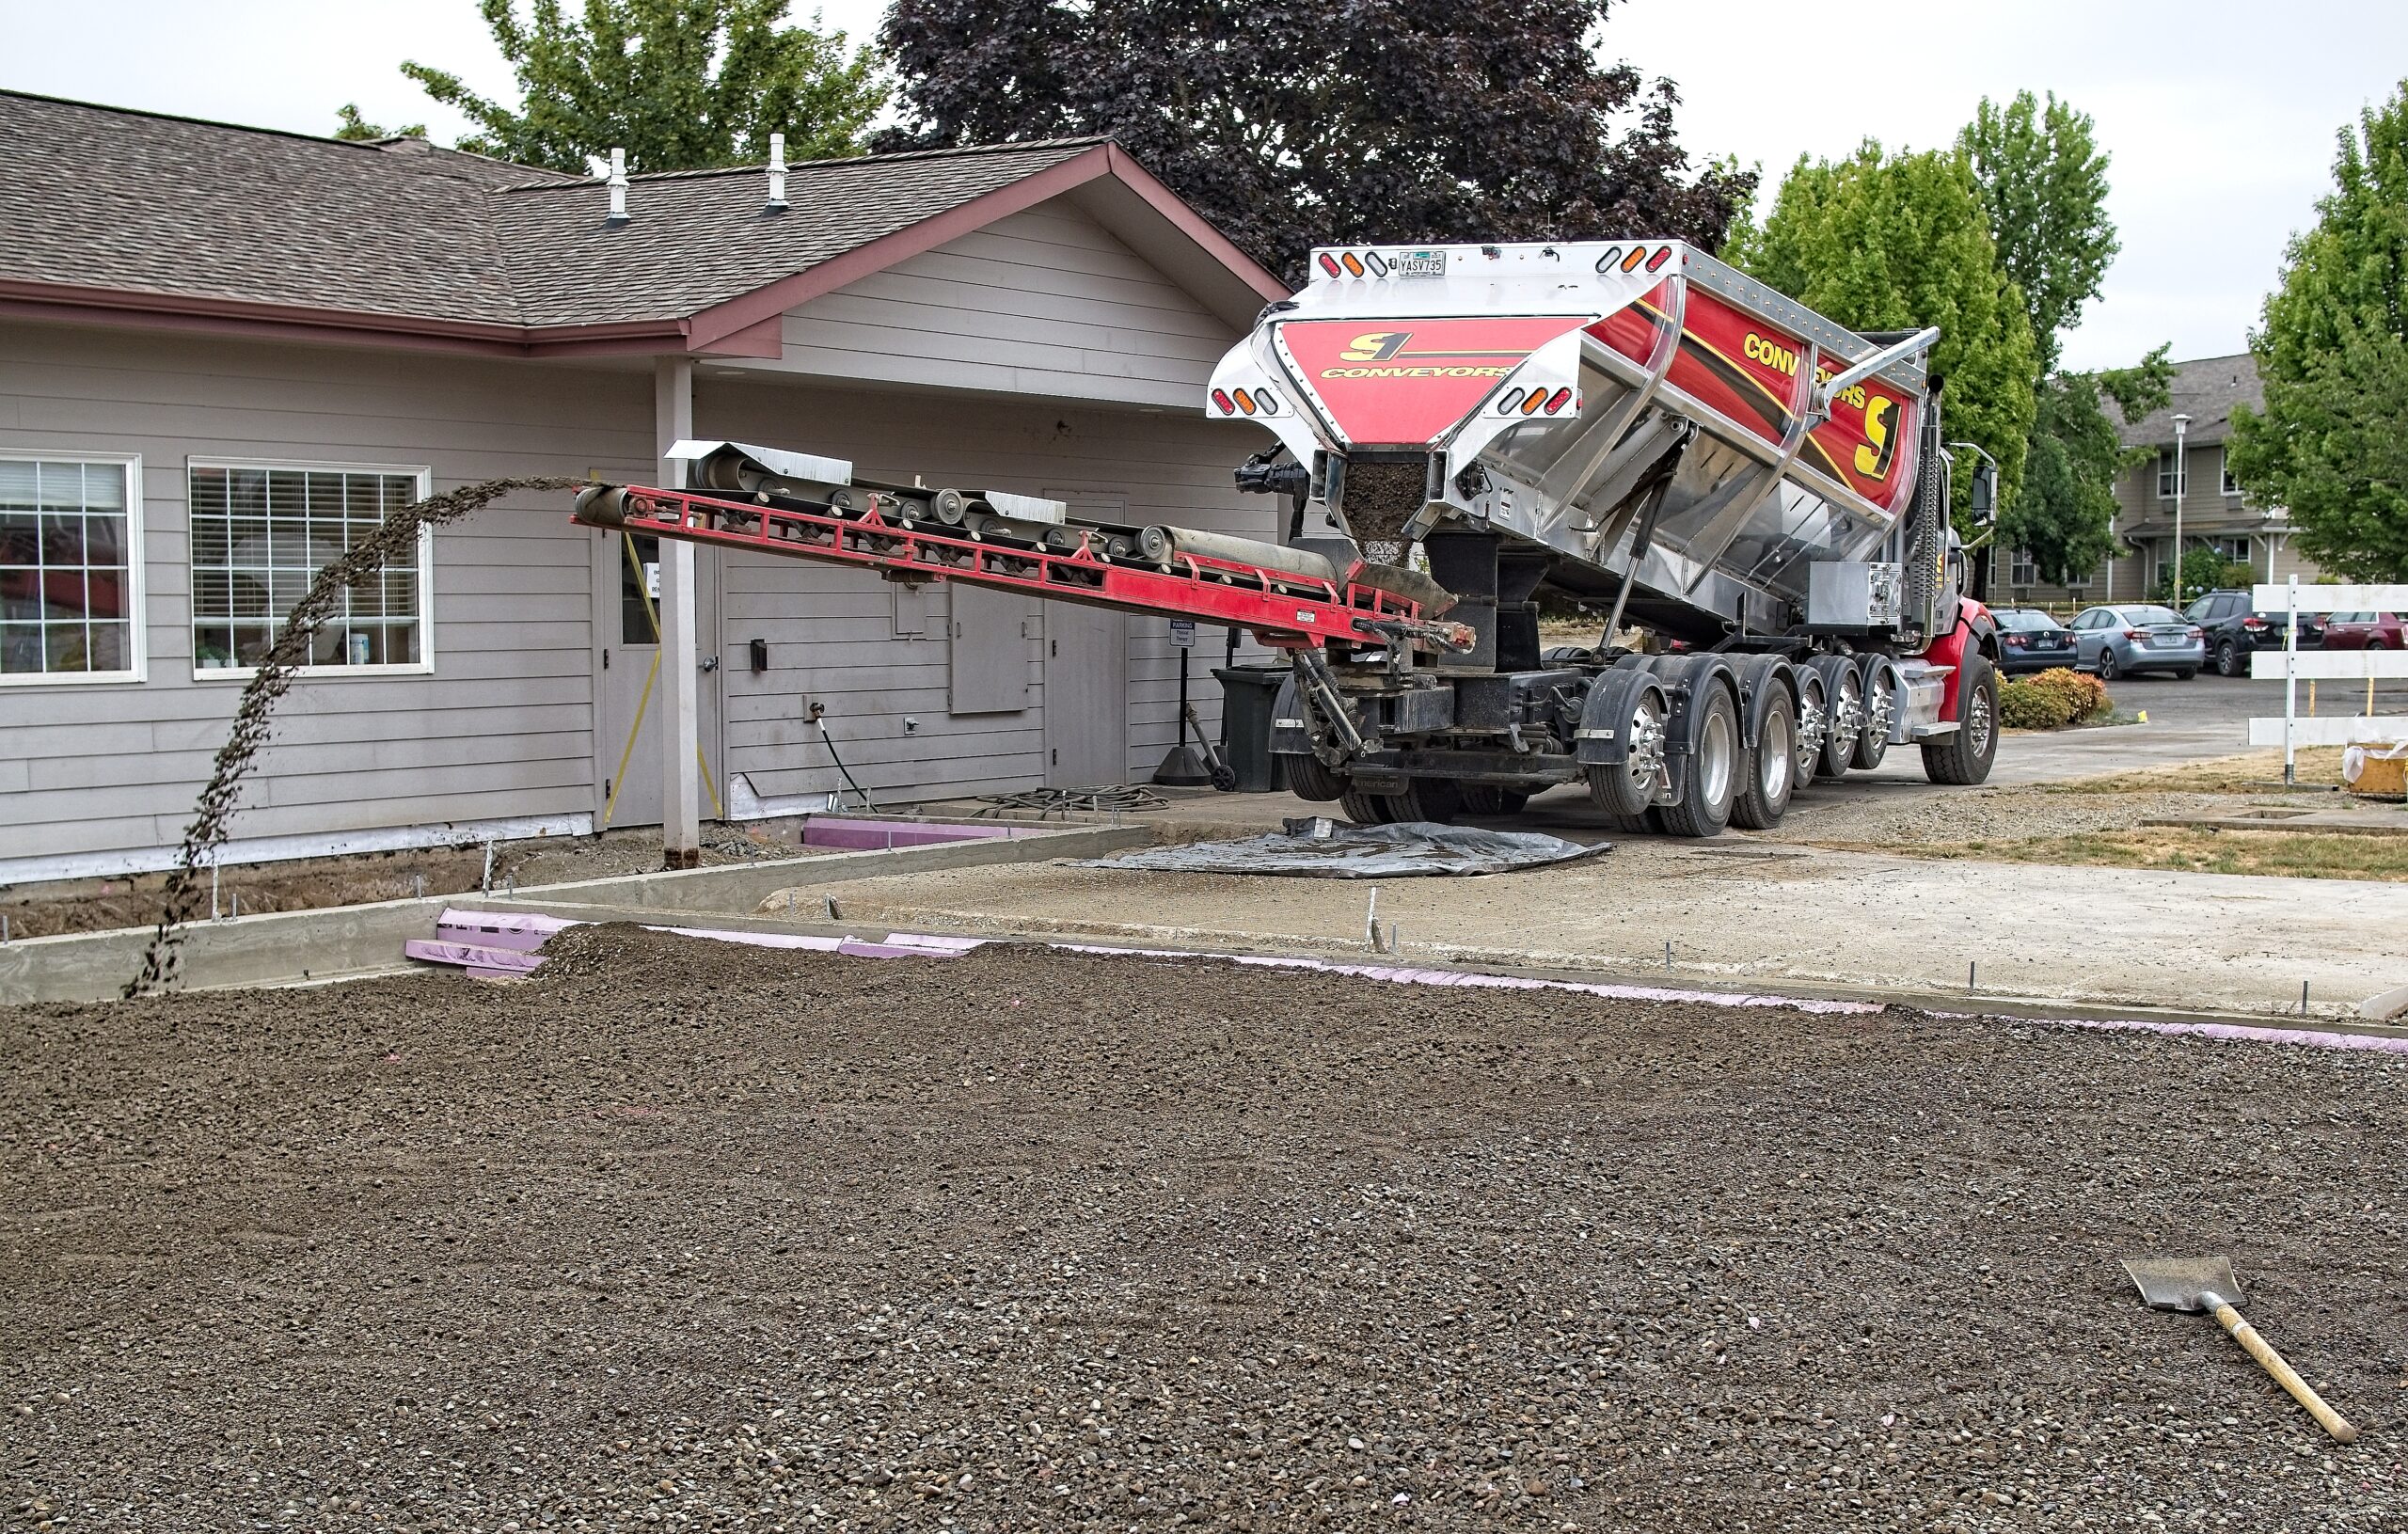
Distributing Gravel
If you are looking for a conservative portfolio look no further than the Millikan. Before digging into the Millikan details, just a word about the above photo. There is an 11 million dollar renovation project under way where we are living and the above gravel truck was interesting in that the operator controlled the boom via blue-tooth so he could scatter the gravel where needed. Quite the operation.
Now into the analysis of this conservative portfolio. With the market punching through new highs I’ve been moving equity holdings into short-term treasuries such as SCHO and SGOV as well as inflation protection ETFs. This move began nearly four months ago with the Millikan. As you will soon see, the Millikan beta is a very low 0,078.
Millikan Security Holdings
Below are the current holdings within the Millikan portfolio. The bulk of the portfolio is invested in short-term treasuries and inflation protection ETFs.
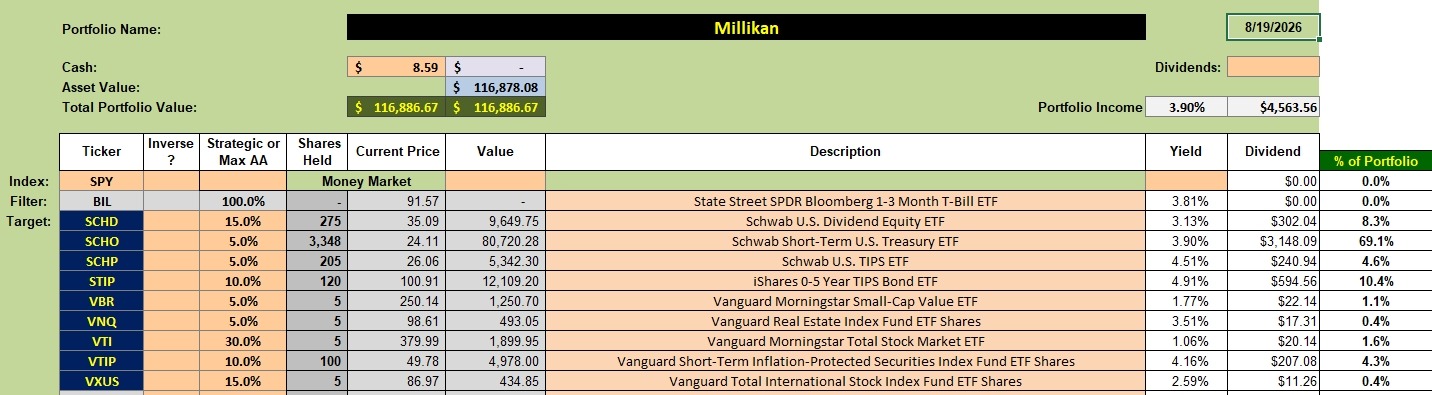
Millikan Rebalancing Recommendations
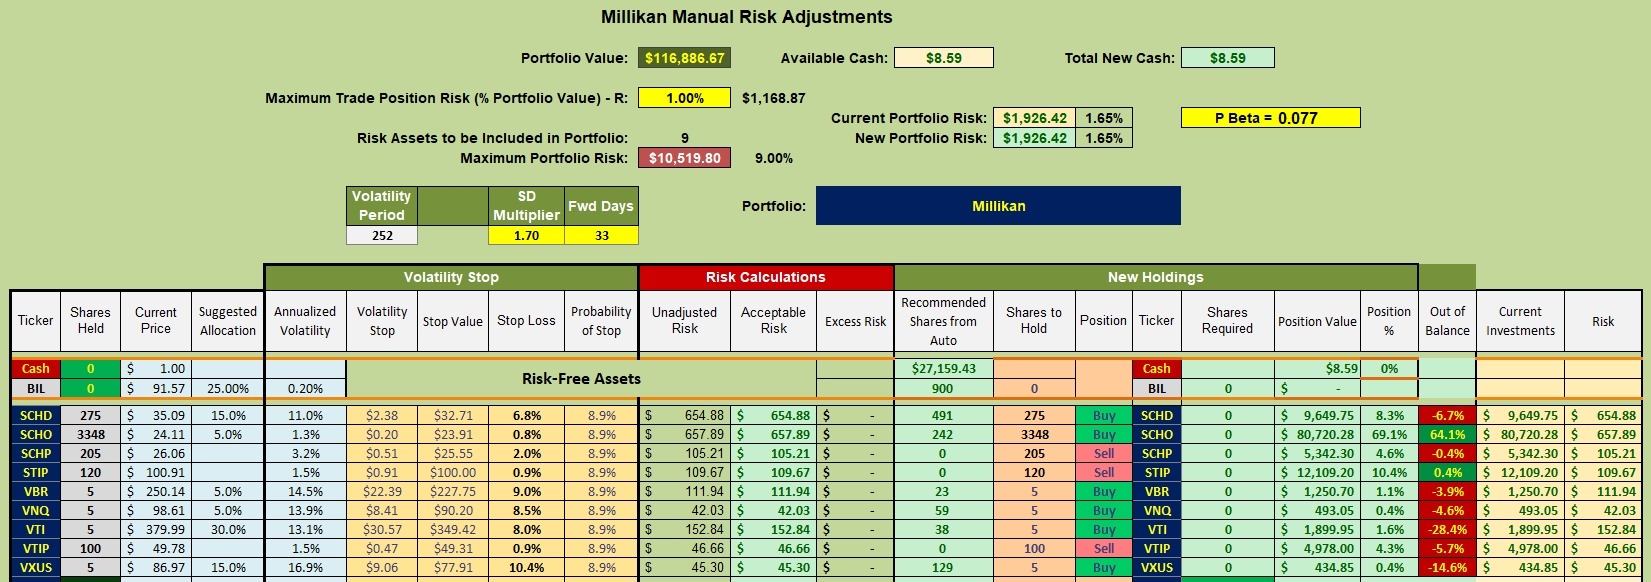
No rebalancing is in the near future. The Millikan will throw off nearly 4.0% in dividends and those earnings will be reinvested in similar ETFs so long as the market holds around current levels. Should we experience a correction (market drop of 10% or more) I will begin to rebuild VTI, VBR, VXUS, and similar equity oriented tickers. It is much too early to begin this process.
Pay attention to the Buffett Indicator and Shiller CAPE Ratio.
Millikan Performance Data
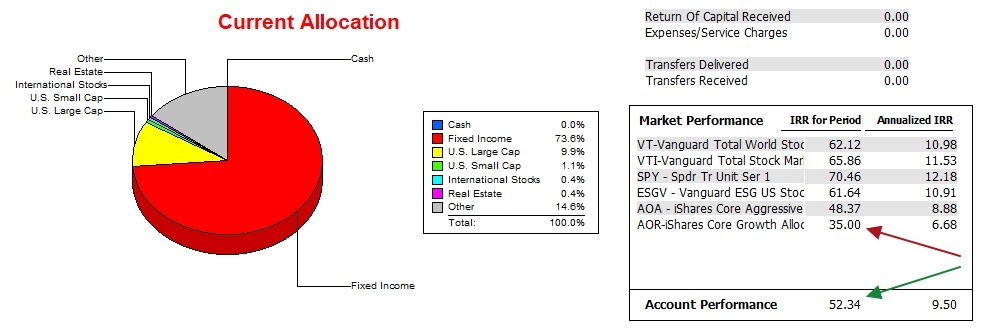
Since 12/31/2021 the Millikan has outperformed AOR benchmark, but is woefully behind the S&P 500 standard. These Internal Rate of Return (IRR) values could easily change dramatically as they did in 2000 – 2002 and during the 2008-09 financial crisis.
The IAM software continues to miss assigning some of the ETFs as seen in the pie chart below. Other designation is likely the inflation protection ETFs.
Millikan Risk Ratios
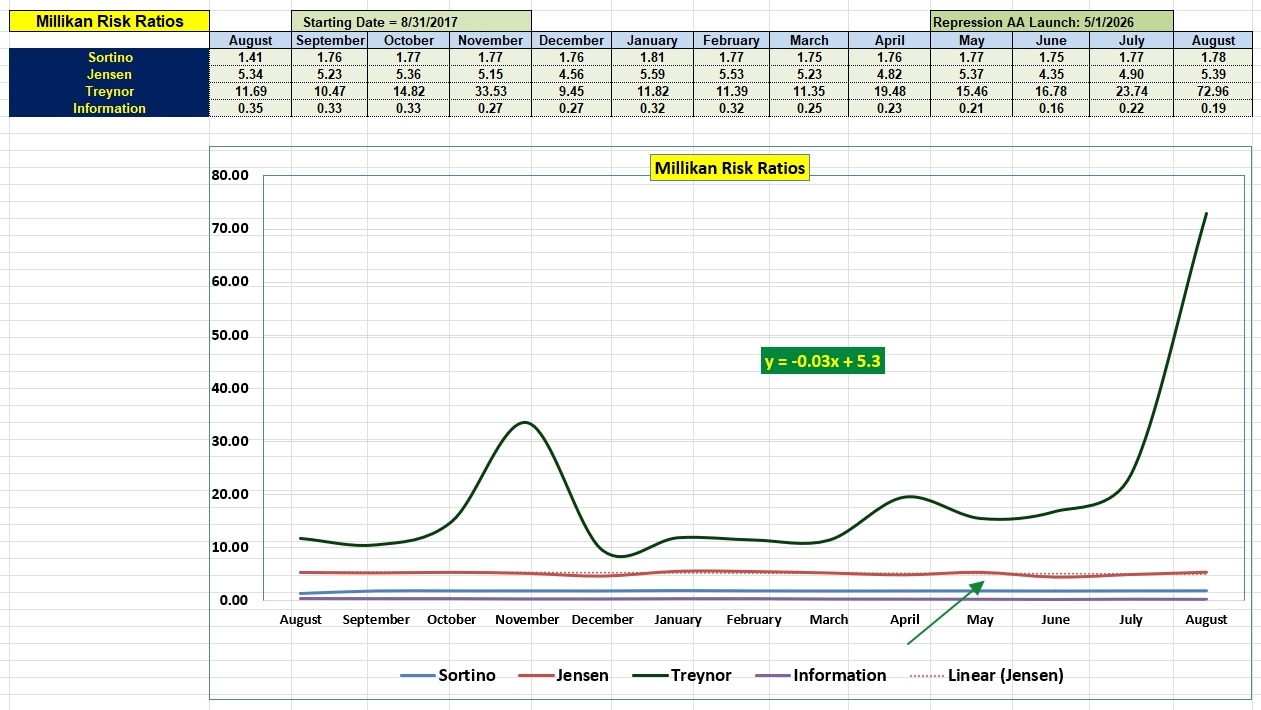
Over this past year the Jensen Alpha (also known as Jensen Performance Index) is holding steady around 5.0. Anything above zero is very acceptable.
The Treynor skews the overall graph as it is highly dependent on the portfolio beta. If the beta is low, as it is with the Millikan, the Treynor is “off the chart” in either direction depending on whether or not the portfolio beats or misses its benchmark.
The all-important Information Ratio indicates the Millikan is gradually losing ground to the benchmark. This is not surprising in a rising market when the portfolio is this conservative.
This is not a time to chase a rising market. A lot of warning flags are flying and one needs to pay attention to a cracking bond market. Do your own research as this site is not investment advice. It is just an educational site laying out how one investor is working within the current market.
Comments and questions are always welcome.
To read all blog posts, register as a subscriber. The site is free and there is no future catch.
Financial Repression Portfolio Update From ChatGPT
Financial Repression Portfolio from ChatGPT
Discover more from ITA Wealth Management
Subscribe to get the latest posts sent to your email.
Lowell,
I notice that you are reporting on one of the Kipling spreadsheet’s sheets above. Have you updated any of the Kipling 5.1.6.3 spreadsheets lately? Starting this week I have not been able to download prices using any of my Kipling 5.1.6.3 spreadsheets. I end up with a blank Adj_Close sheet.
~jim
Jim,
Not being able to download prices most likely is related to the ITA file that resides under ITA within Documents. I better send the lastest file I have an see if that works.
Lowell
Lowell,
I’ve changed computers and have a similar problem with Tingo which still is OK on my old W10 computer but on the new W11 box. I do have the MSFT Office subscription that should be up to date. I’d also appreciate a current version.
Thanks.
Bob Warasila
Bob,
Make sure your Tiingo code or API number is in the file. You need to go to the Tiingo site to pick this up. If I send you my file it will have my Tiingo number in it and that will not work for you.
I’ve asked Hedgehunter to post the file in his Dropbox. Hope to have you running in a day or so.
Lowell