
Idaho Falls, Idaho
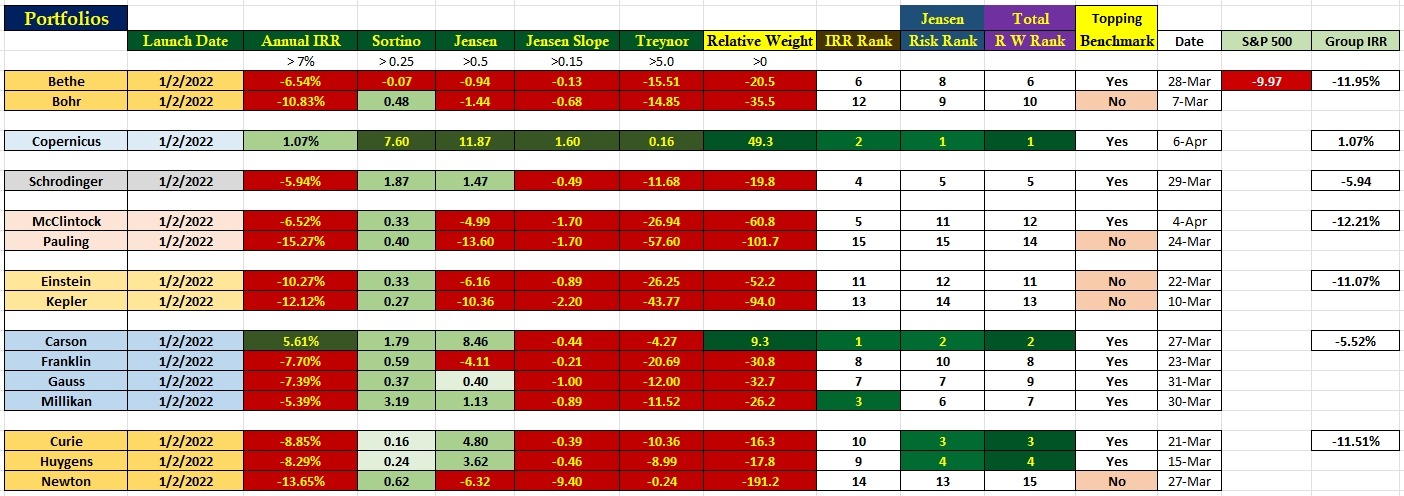
Approximately once a month I post the following portfolio performance data table. Readers need to keep in mind that the data is a rolling look at portfolio performance and is based on the date shown in the third column from the right. Annual IRR data (third column from the left) is current as of April 6, 2023. More explanations to follow.
Performance Comparison Data Table
Based on IRR data the Carson is the top performer. When risk enters the equation Copernicus takes the number one position.
The far right column shows how a particular management model is working. Copernicus holds down the number one position. As regular readers know, the Copernicus is a save and invest in U.S. Equities. Never sell is the driving force.
As a group, the Sector BPI portfolios rank second as they barely edge out the Schrodinger. All other model fall far behind when it comes to IRR results.
The Relative Weight calculation is a proprietary calculation that takes into consideration data found in columns 3 through 7.
I plan to carry all the different models through the debt crisis that will hit us this summer. Once we are through that mess I’ll take a fresh look at the Dual Momentum™ and Relative Strength and make changes if necessary. Before the end of this year I’ll have a better feel how the Sector BPI model is working. Thus far it is on a positive track.
Investors who prefer to spend time doing things other than worrying about their portfolio would do well to set up accounts that follow the Schrodinger and/or Copernicus portfolios. Both are performing much better than the S&P 500.
Discover more from ITA Wealth Management
Subscribe to get the latest posts sent to your email.
You must be logged in to post a comment.