
Smith Rocks – Central Oregon.
Millikan is one of five portfolios employing the unique Sector BPI investing model. Bullish Percent Indicator charting is not what one might call “main stream” investment tracking. It is a different way of monitoring security performance. The Sector BPI investing model breaks the U. S. Equities market down into eleven sectors. Each week I check these eleven sectors to see if any moved into the bullish or bearish zones. If the sector is 30% bullish or lower, the sector is considered to be oversold. When this occurs it is time to purchase the ETF that tracks this particular sector. If any sectors show up as 70% bullish or high, the sector is considered to be overbought and it is time to place a 3% Trailing Stop Loss Order on ETFs that represent overbought sectors.
A little over a week ago three sectors, Discretionary, Energy, and Technology dropped into the oversold zone. Orders were placed for VDC, VDE, and VGT as I use Vanguard ETFs to populate oversold sectors.
Millikan Investment Quiver and Holdings
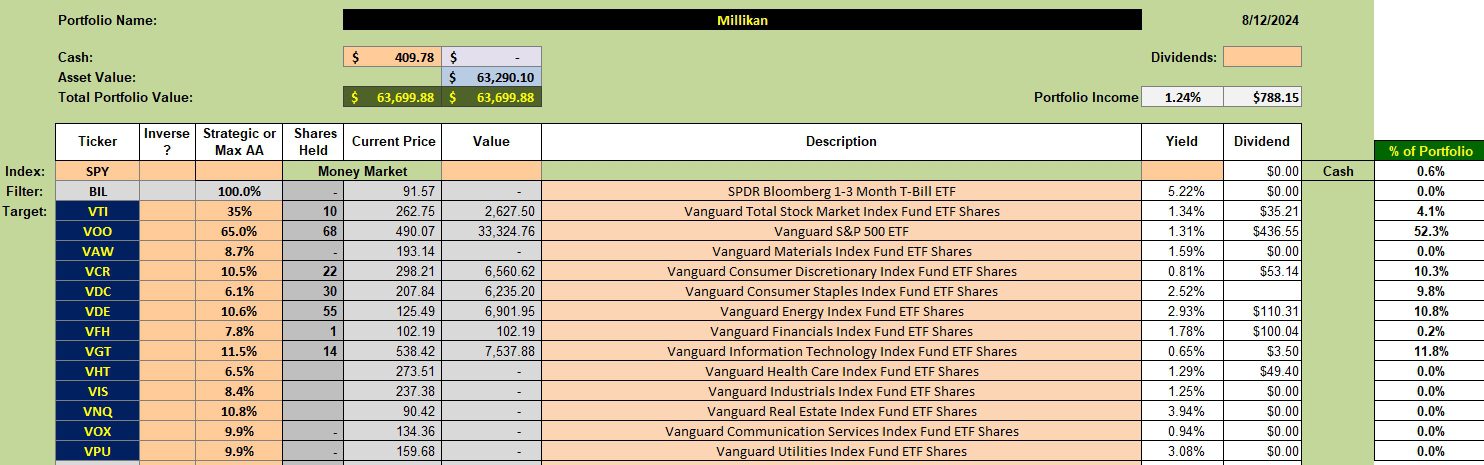
Below are the current Millikan holdings. In the third column from the left we see the Max Asset Allocation percentage. I use a three-year volatility average to determine what maximum percentage to invest in each sector. When sectors are out of favor I invest in VOO and/or VTI.
As an example, the goal is to hold 10.6% in Energy (VDE) when the sector is oversold. The current holding is 10.8% or right on target. I see where I overshot Consumer Staples as the goal is 6.1% while the current holding is 9.8%.
Millikan Performance Data
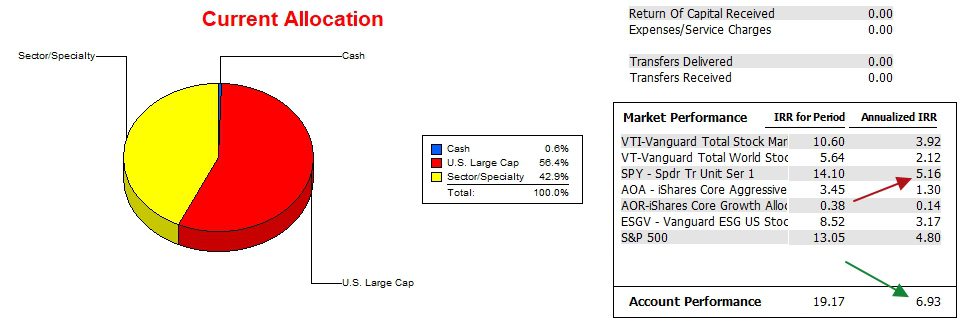
The newest ITA portfolios were launched at the end of 2021 and that is why I use 12/31/2021 as the date for tracking ITA portfolios. Many go back many years, but to compare performance over the same time period I use 12/31/2021 as the launch date.
Over the past 20 months the Millikan has outperformed the SPY benchmark, 6.9% to 5.2%. The gap is wider for other potential benchmarks. I use the S&P 500 as a benchmark since the goal of each Sector BPI portfolio is to match or exceed the S&P 500. Note that the investable SPY (5.2%) is actually performing a bit better than its index (4.8%).
Millikan Risk Ratios
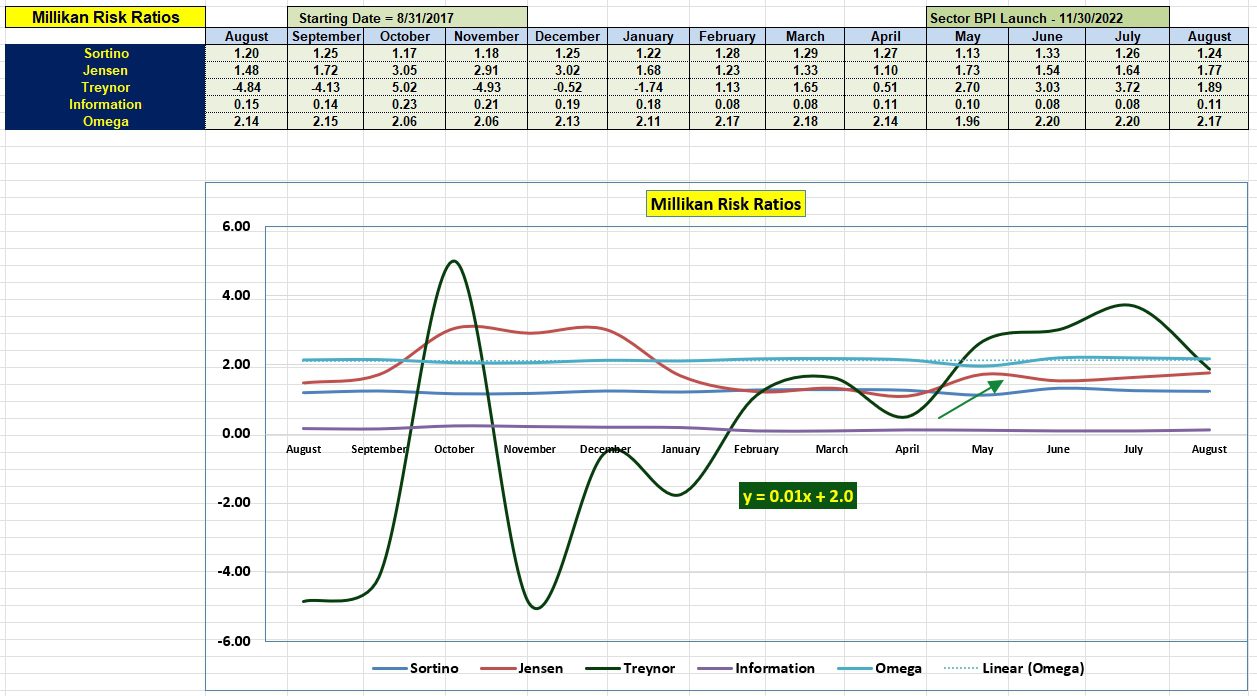
The Millikan risk data table is filled with positive values. Pay most attention to the Jensen Performance Index and the Information Ratio. Both exhibit strong values this month.
The slope of the Jensen is flat which is acceptable during the Dog Days of Summer. We see some improvement since a year ago.
Millikan Sector Portfolio Report
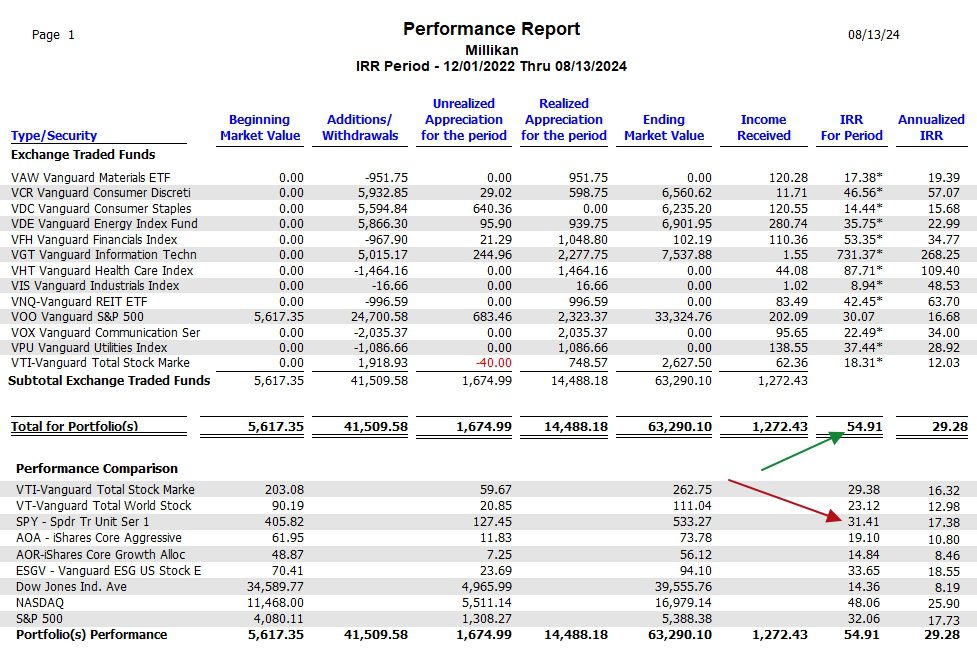
The following table is a check on how well the Millikan performed since employing the Sector BPI model. While using this model the Millikan returned 54.9% while the SPY benchmark returned 31.4%. The difference is quite remarkable and speaks well for the Sector BPI investing model.
Performance data comes out of the Investment Account Manager software, a commercial product I highly recommend for serious investors.
Millikan Sector BPI Portfolio Review: 10 May 2024
Returning To Investing Roots: 5 August 2024
Discover more from ITA Wealth Management
Subscribe to get the latest posts sent to your email.
You must be logged in to post a comment.