
Giant Bonsai, Kew Gardens, London, England
In part 2 of this series of posts on how I intend to construct and manage the Rutherford-Darwin portfolio going forward (https://itawealth.com/rutherford-darwin-portfolio-restructuring-the-management-plan-part-2-asset-allocation-and-risk-management/ ) I outlined methods for allocating funds to the portfolio – on the assumption that the relationship between price and volatility was the same for all assets. In that post I analyzed the historical relationship for SPY, as representing US Equities.
However, this does not necessarily mean that the same price-volatility relationship exists for other asset classes. Consequently, I have chosen to perform a similar analysis on Commodities and have chosen to use IAU (an ETF that tracks the price of Gold Bullion) to represent that asset class.
The following graph shows the 21-day volatility (annualized) of IAU from its inception in January 2005 to the present time:
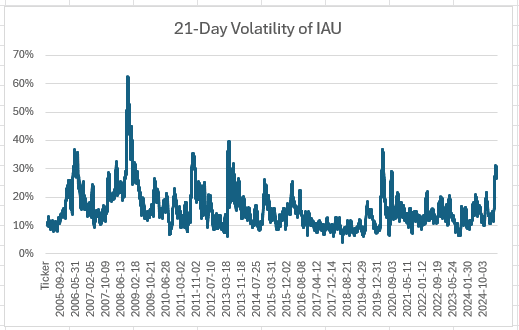
Volatility peaked at the height of the financial crisis in 2008 and again in 2011, 2013 and 2019. It is also currently trading at ~2x its average level over the ~20 year period.
As I did with the SPY analysis I also look at the relationship between current volatility and the actual (realized) volatility over the following same 21-day period:
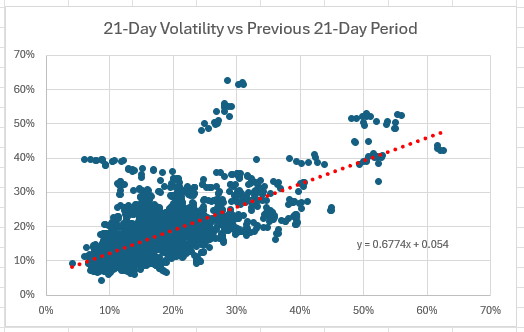
And, again, we see the “sticky” relationship such that volatility tends to remain close to what it was in the previous period.
If I then adjust my allocations (daily) based on the difference between current volatility and the average long-term volatility (in this case 15.8%) such that I allocate less when volatility is high (more risk) and more when volatility is low (less risk) I see the following equity curves:
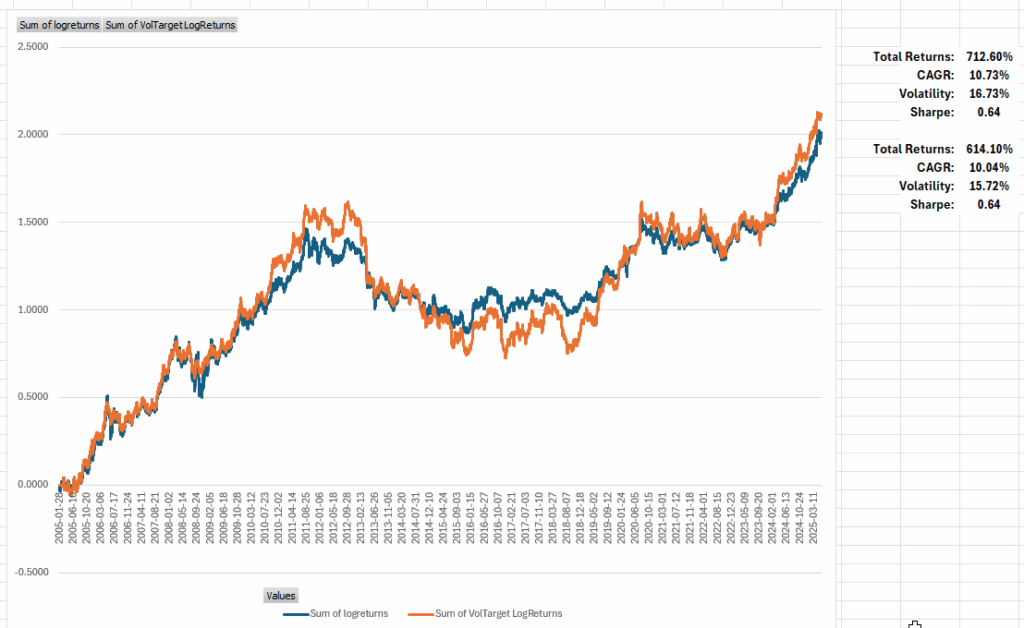
While the impact on returns is not as significant as it was on equities, making adjustments may still be beneficial. However, should I need a little more flexibility in order to be able to hold 100-lot shares (that allows me to sell Options against them) then I might favor the opportunity to apply that flexibility and to round to the nearest 100-lot shares.
Discover more from ITA Wealth Management
Subscribe to get the latest posts sent to your email.
Leave a Comment or Question