
Germany
You have to pick what you’re going to be worried about. Markets are volatile, but retirement is certain. – Nick Murray
As an investing model the Sector BPI approach continues to hold up well when compared to the S&P 500. While the performance data goes back to 12/31/2021 or when the last portfolio was launched, Internal Rate of Return (IRR) values are not always that great going back that far. Less than stellar performance was the major reason for moving the Kepler over to the Sector BPI model once the Carson (earliest Sector BPI portfolio) began to show promise. The Kepler is one of the more recent conversions to the Sector BPI model.
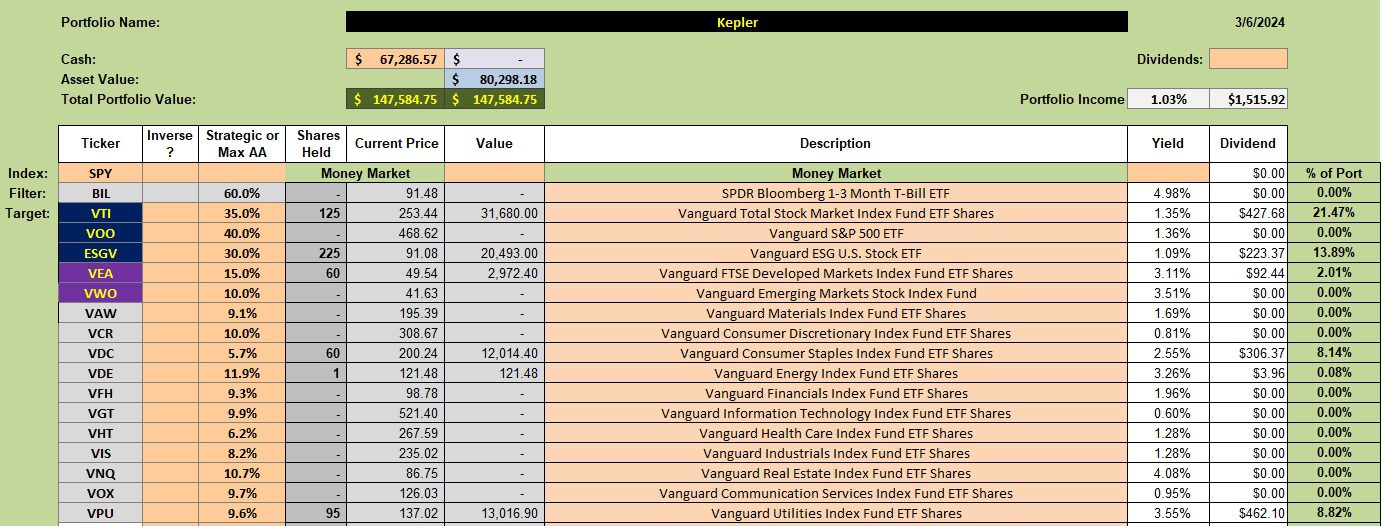
Kepler Security Holdings
Changes are coming to the Kepler investment quiver as I have TSLOs set to purge ESGV and VEA from the portfolio. When sectors are out of favor, as is currently the situation, available cash will be invested in VTI and VOO. I no longer plan to use VWO, despite the diversity advantages.
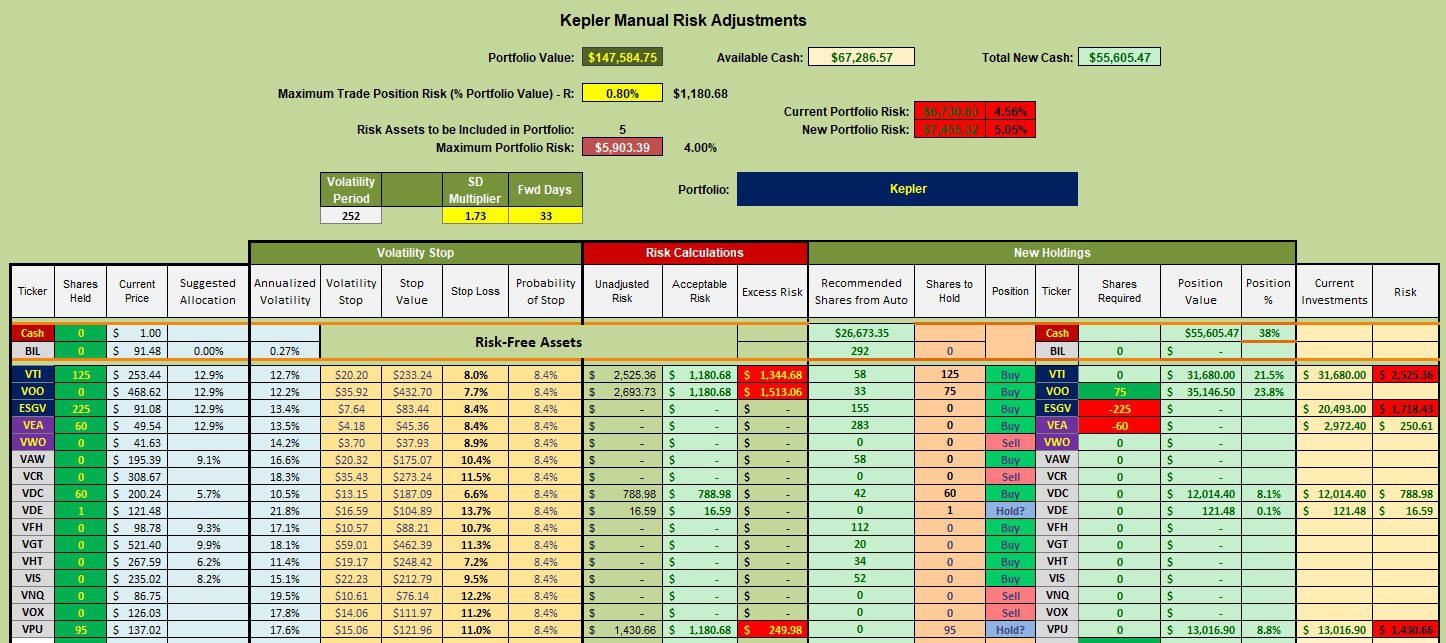
Kepler Manual Risk Adjustments
While I use the Manual Risk Adjustment worksheet with the Sector BPI portfolios, I override the advice as you can see below. Eventually ESGV and VEA will be eliminated. VWO is also on the chopping block. I plan to concentrate on investing in VOO as this ETF mirrors the S&P 500 and that benchmark is the standard for the Sector BPI portfolios.
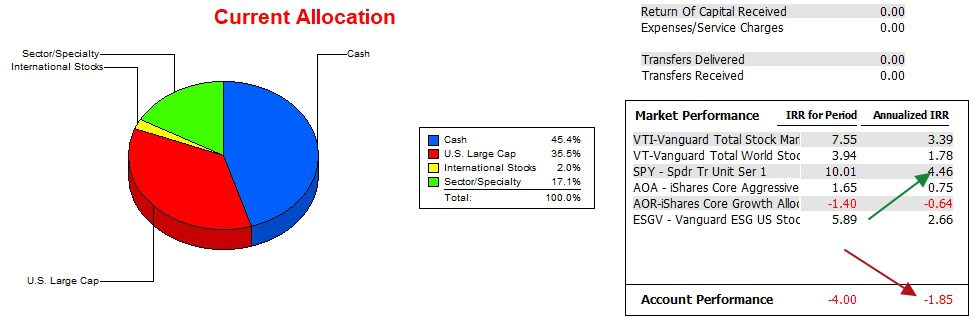
Kepler Performance Data
Going back to 12/31/2021, the Kepler continues to lag the SPY ETF. SPY is the investable security designed to match the performance of the S&P 500. VOO is also such an ETF. The Kepler is performing much better since stitching to the Sector BPI model.
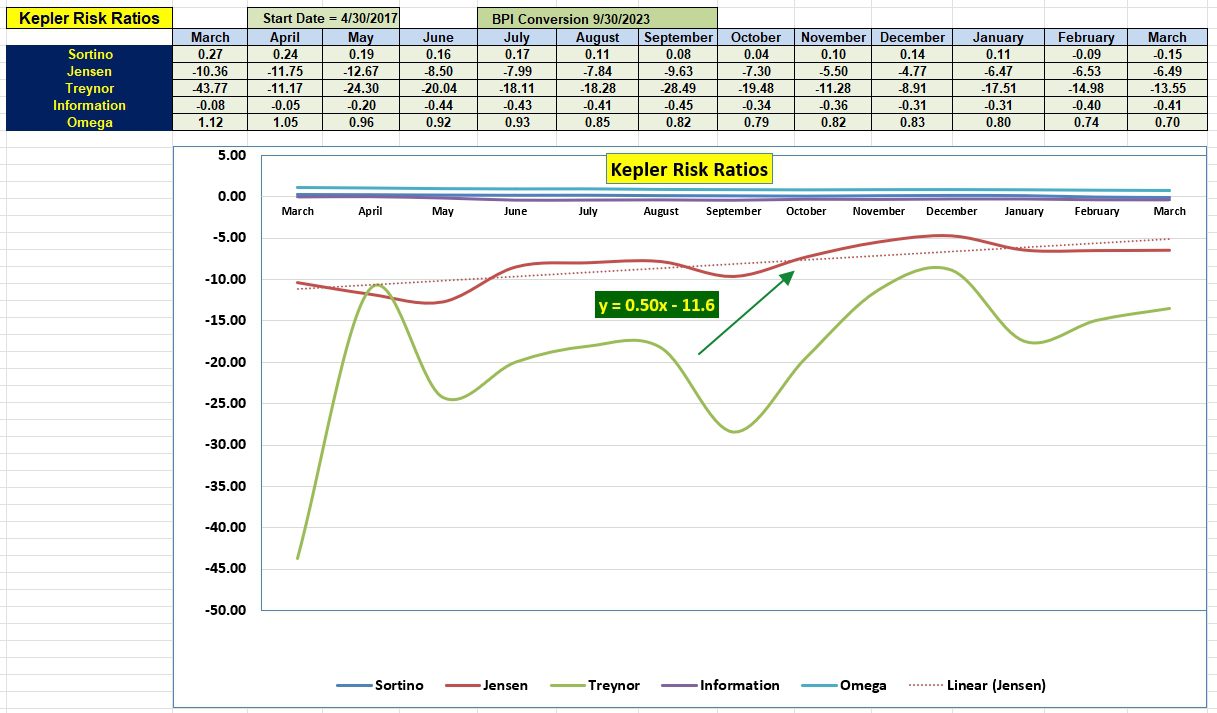
Kepler Risk Ratios
Over the past year the Kepler is improving on a risk adjusted basis. The Information Ratio is still negative, but not insurmountable. We might see a positive value before the end of the year.
Numerous limit orders are in place to purchase shares of VOO if and when the market takes a breather. One was struck as I made the final edit of this blog post.
Discover more from ITA Wealth Management
Subscribe to get the latest posts sent to your email.
Lowell,
I noticed something in your recent Seeking Alpha article (https://seekingalpha.com/article/4676660-sector-bullish-percent-indicator-investing-model-an-s-and-p-500-beater?mailingid=34602379&messageid=2850&serial=34602379.71&utm_campaign=rta-author-article&utm_medium=email&utm_source=seeking_alpha&utm_term=34602379.71) that I hadn’t previously realized – i.e. that you are weighting sector ETF allocations in direct proportion to volatility. Obviously we hope that we are rewarded for taking more risk – so, from that point of view it makes sense. However, this is in direct contradiction to the classical “conventional wisdom” of risk parity – where we would overweight less volatile assets to reduce overall portfolio volatility.
As you know I am personally not a big fan of risk parity – but it does make sense for some investors that might be more risk averse. It will be interesting to see if the BPI portfolios benefit from this more aggressive approach. I highlight this feature of your model here just in case other readers had (like me) missed this feature of your model.
David
Great comment and question. John
David,
Correct. The more volatile the sector the higher the probability it will find its way into oversold and overbought zones. The Sector BPI model argues the more cycles (Buy and Sell) sectors enter these extreme zones the greater the profits. Therefore, I want to have more invested in the sectors with higher volatility. If you check the percentages, the differences are not all that great, although they are not trivial when one thinks of percentage differences.
One could use identical percentages. I’ve been using this model for many months.
Lowell