
Stick sculptures at Orenco Park near Hillsboro, OR
Pauling is one of three asset allocation portfolios I watch over here at ITA. The other two are the Schrodinger and the Huygens. Pauling and Huygens are new to this model as each has only been operational for three months. Asset Allocation as an investment model has a long history as most portfolios are constructed around broad diversification. Hedgehunter tracks the Rutherford, another asset allocation style portfolio.
Pauling Asset Allocations
Below is the asset allocation or ETFs used with the Pauling. The Max AA is based on three-year volatility and some intuition. Over in the right-hand column we have Out of Balance percentages. The goal is to keep each asset within + or – 0.5%. Should a particular asset “run ahead” as is the case with VB, we let that asset run rather than sell and bring it back into balance. If the asset becomes too far out of balance, say >5% I might sell and take the profits. However, the general rule is to not sell, but rather use fresh cash and dividends to built up those asset classes that are lagging.
Current ETFs that need to be built back up so they come within the asset allocation limits are: VTI, BNDX, BND, VNQI, VEA, and GSG. I am not a fan of Gold (GSG) so I may place a limit order on that ETF and use the cash to purchase more shares of BND or the ETF most out of balance.

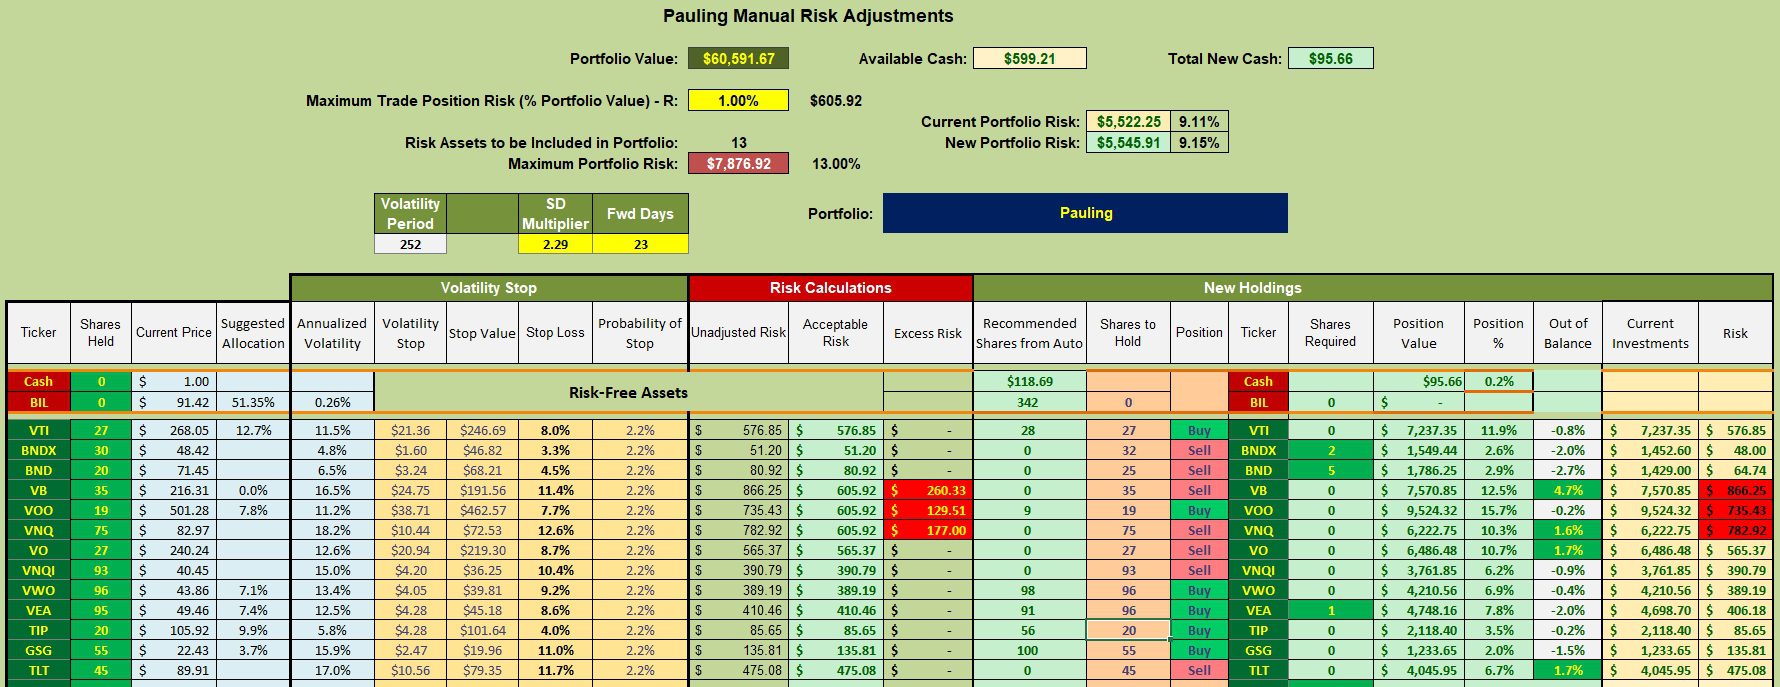
Pauling Manual Risk Adjustments
I use the Manual Risk Adjustment worksheet from the Kipling spreadsheet as a guide to determine where to invest cash. Currently I have limit orders in place to purchase shares of BNDX, BND, and VEA.
Pauling Performance Data
Since 12/31/2021 the Pauling, under the former management model, performed poorly compared to the SPY benchmark. In fact the Pauling lags all possible benchmarks. Hence the move to the Asset Allocation investing model.
When I updated the June performance for the Pauling and compared it with the June performance for the Copernicus, the Copernicus increase was much larger. Large-cap stocks that make up VOO are performing much better that the diversified portfolio as we have with the Pauling. Once more, it is difficult to outperform the S&P 500.

Pauling Risk Ratios
Since the Pauling has only been using the AA model for three months it is much too early to judge this investing model. The Jensen is better than it was a year ago, but it is far from stellar.
Keep an eye on the slope of the Jensen as that will provide a clue as to viability of this model. We need several more months of data before we make much out of the current positive trend.

Discover more from ITA Wealth Management
Subscribe to get the latest posts sent to your email.
You must be logged in to post a comment.