
St Louis Fountain
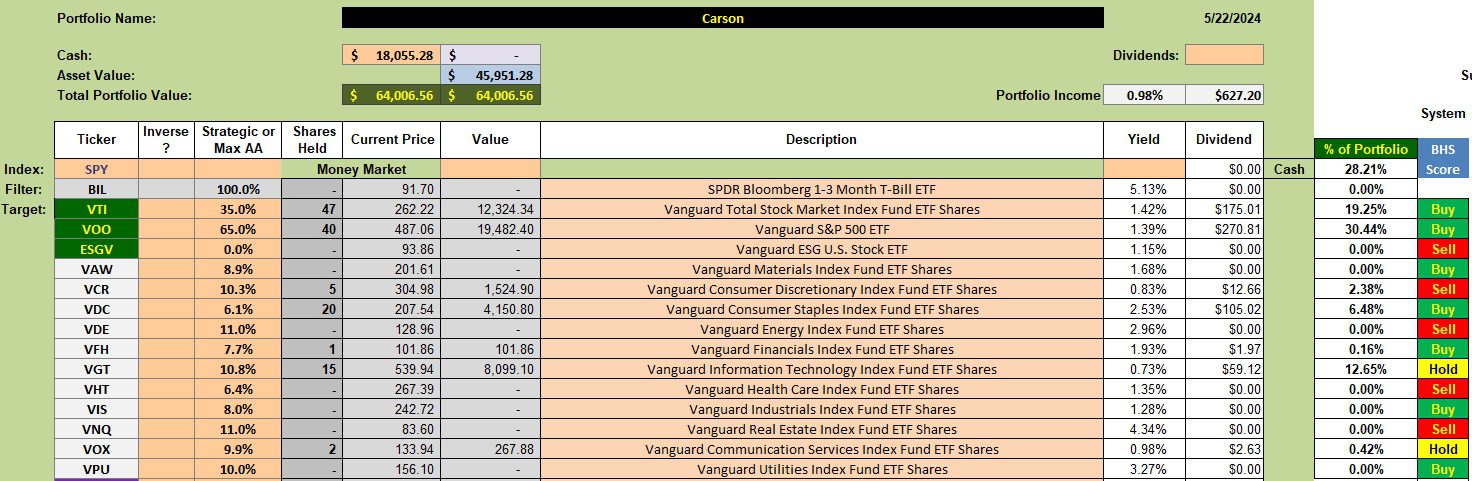
Carson is the oldest Sector BPI portfolio as well as the top performer employing this particular investing model. One change that took place since the last review is the recent sale of shares of VPU. The Utilities ETF triggered the 3% TSLO set a number of weeks ago. Another “major” sector holding, Technology, moved into the overbought zone so VGT is also operating with a TSLO in place.
Carson Security Holdings
Below is the investment quiver and current holdings in the Carson portfolio. I have a number of limit orders set to add more shares of VTI and VOO as there is plenty of cash available.
Carson Manual Risk Adjustments
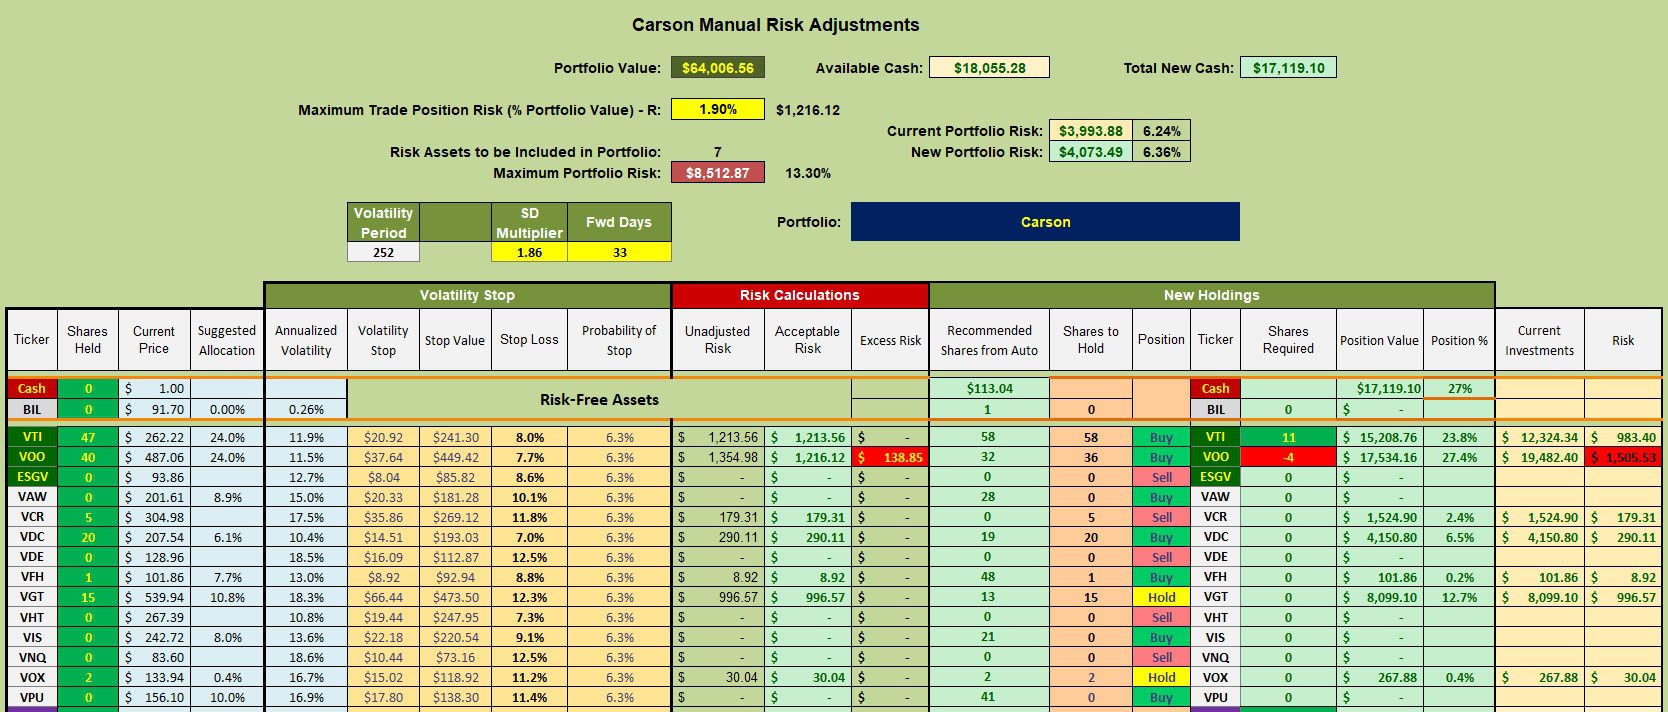
Neglect the 4 shares of VOO that show up as a sell. I neglected to update the following table after four more shares of VOO were added to the Carson this morning.
When there are no oversold sectors the available cash is invested in U.S. Equities when Buy recommendations show up as they currently do for both VTI and VOO.
Carson Performance Data
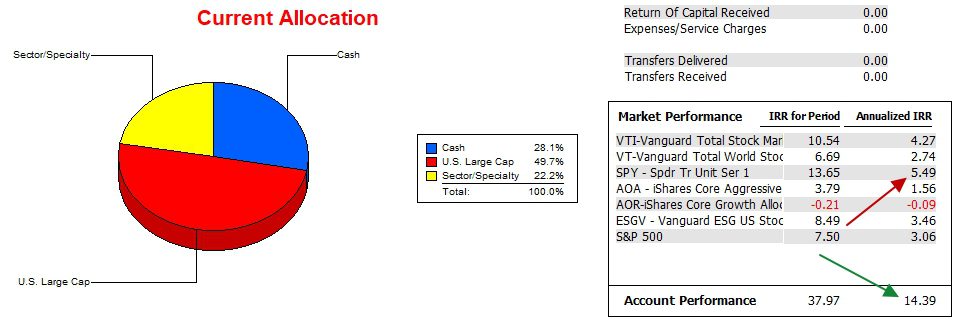
Since 12/31/2021 the Carson continues to outpace the S&P 500 and the S&P 500 ETF, SPY. SPY is the benchmark as it is a security one can use as an investment. It is interesting that the SPY ETF is performing better than the index (S&P 500) it is to mirror.
The race is not even close between the Carson and the other five potential benchmarks.
This data comes from Quant IX (Investment Account Manager) and if you checked the Forum, Quant is coming out with a new version of IAM.
Carson Risk Ratios
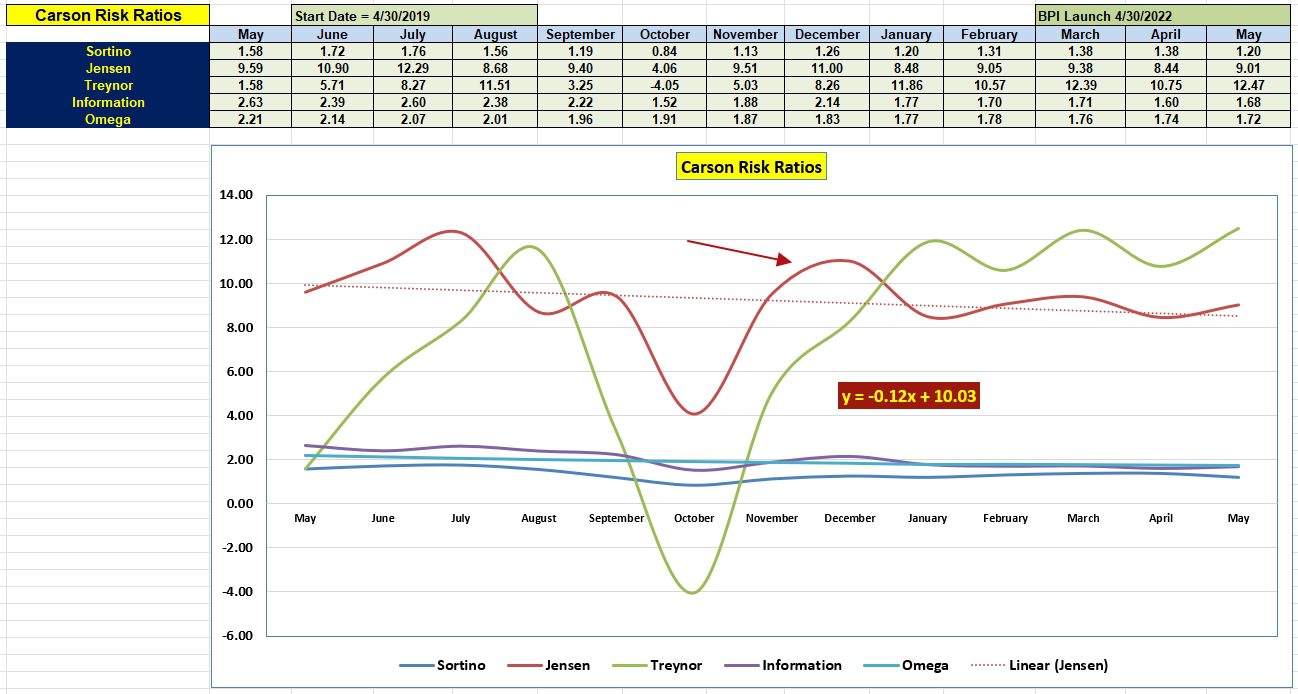
Based on the five risk ratios, the Carson is a high performer. Pay most attention to the Jensen and Information Ratios as well as the slope of the Jensen. The slope should turn positive once we hit October.
Carson Sector Portfolio Report
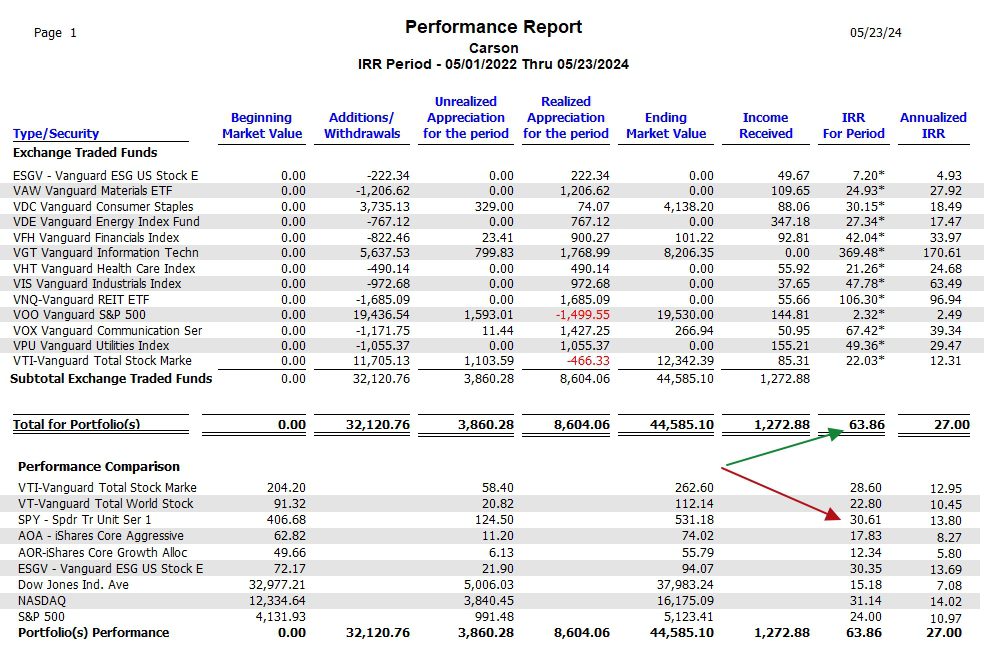
Within the Investment Account Manager software one can isolate the securities used to populate a portfolio over a specific period. In May of 2022, or two years ago, I began implementing the Sector BPI model with the Carson portfolio. Since that time the Carson gained 63.9% while the SPY benchmark moved up 30.6%. The S&P 500 gained 24.0% over this two year period.
Conclusion: The Sector BPI model worked very well over the last two years.
Tweaking Sector BPI Plus Investing Model: Part II
Discover more from ITA Wealth Management
Subscribe to get the latest posts sent to your email.
Lowell,
I suspect the reason that SPY appears to be outperforming SPX (that it is designed to “mirror”/track) is because SPY pays a dividend – so returns from SPY will reflect the inclusion of this dividend. SPX (Index) is not (directly) tradeable so does not have a dividend associated with it.
David
David,
Would a dividend make this much difference? The current dividend for SPY is 1.34%.
When a dividend is paid I thought the price of SPY is adjusted downward. Not so?
Lowell
Lowell,
Difference in returns from your number above is 5.49% (SPY) – 3.06% (SPX) = 2.43% over ~2+ years – so looks close enough for government work to me 🙂
David