
Japanese Garden on a foggy morning.
Gauss is one of the more recent portfolios to be moved from the Relative Momentum model (expanded version of the Dual Momentum model) over to the Sector BPI Plus model. This conversion occurred a little less than one year ago. I just checked to see how well this Investment Quiver performed vs SPY. Over the past eleven months the Gauss generated a 14.5% annualized return vs. 9.8% for SPY. In the following analysis I use data going back to the end of 2021 so we catch the poor performance during 2022. Therefore overall performance is lower.
The following analysis is a full review of the Gauss and how it is set up to move forward over the next few months.
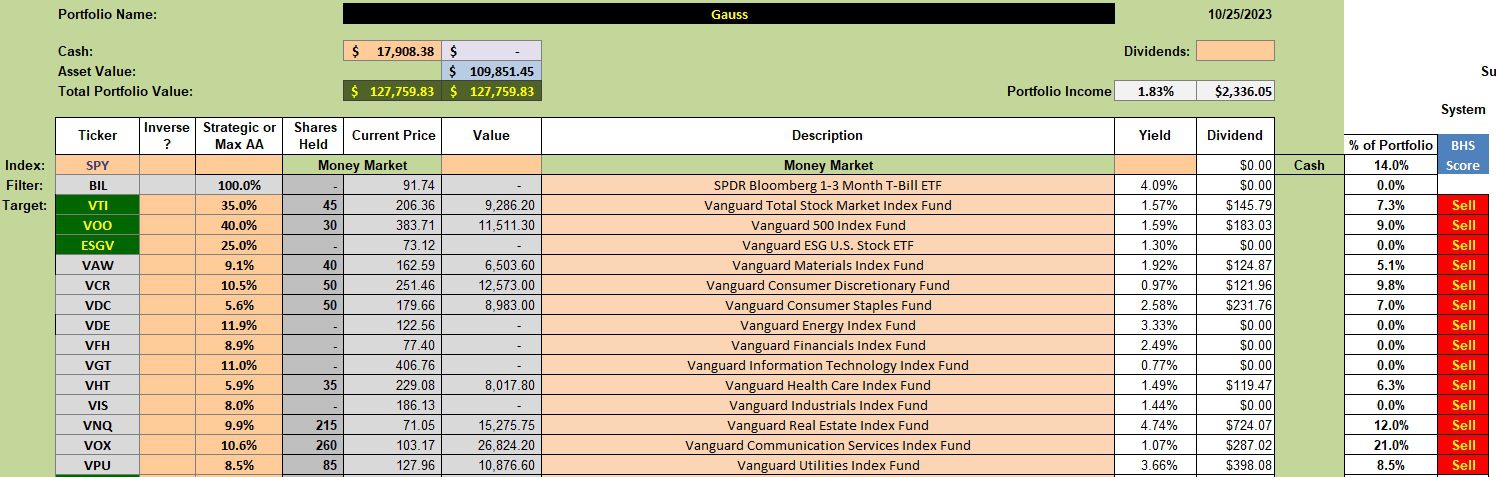
Gauss Investment Quiver and Holdings
The following investment quiver includes three U.S. Equities. They are: VTI, VOO, and ESGV. While these three ETFs are highly correlated, there are differences. VTI covers the entire U.S. Equities market while ESGV is a social responsible ETF.
Money managers might select one of the three U.S. Equity ETFs and then add on the eleven sector ETFs to make up a Sector BPI portfolio.
While the nearly $18,000 is a high percentage to carry as cash, note that I have multiple limit orders in place should the market dip further south.
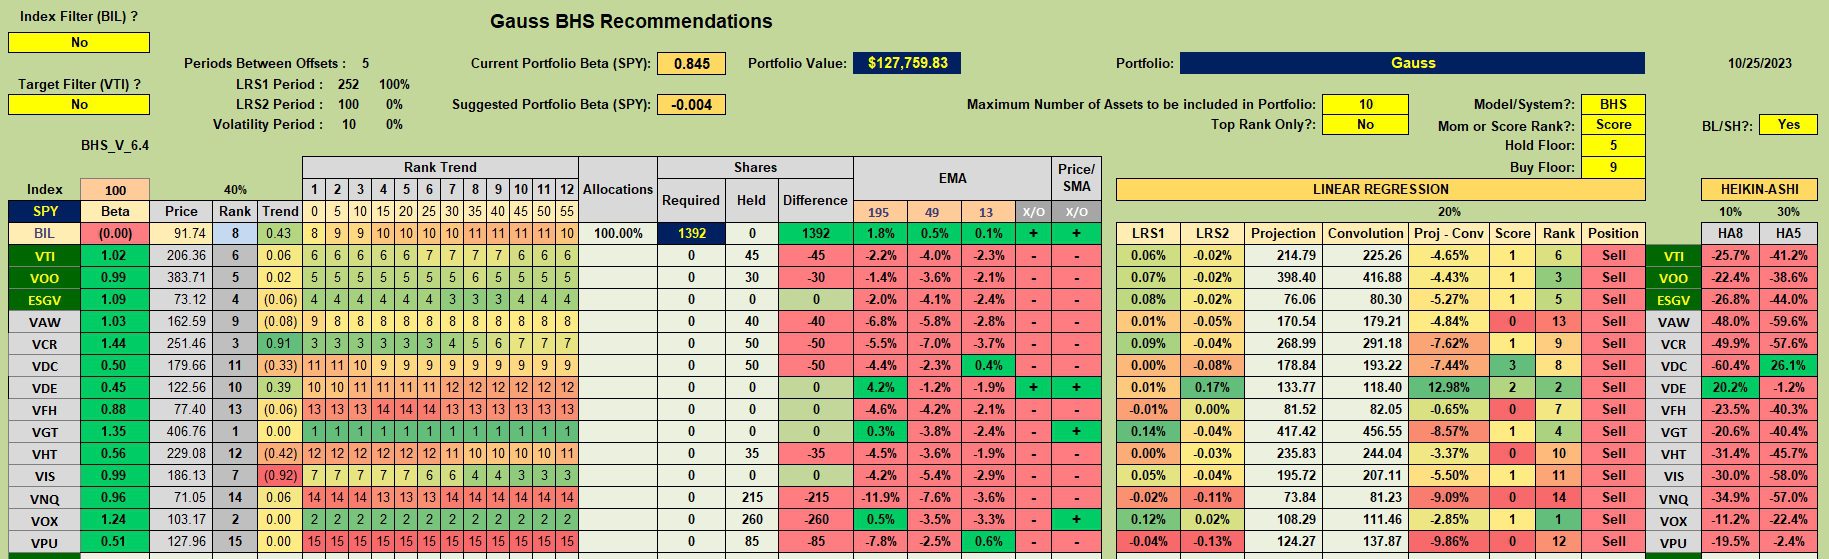
Gauss Security Recommendations
Since the following worksheet from the Kipling indicates not adding to any of the three equity ETFs, I’ll stand pat with the current holdings. Five sector ETFs are a buy based on BPI data. They are: Materials, Discretionary, Staples, Real Estate and Utilities. Before reviewing the McClintock tomorrow I’ll check on the Bullish Percent Indicator (BPI) data to see if any other sectors joined the oversold crowd.
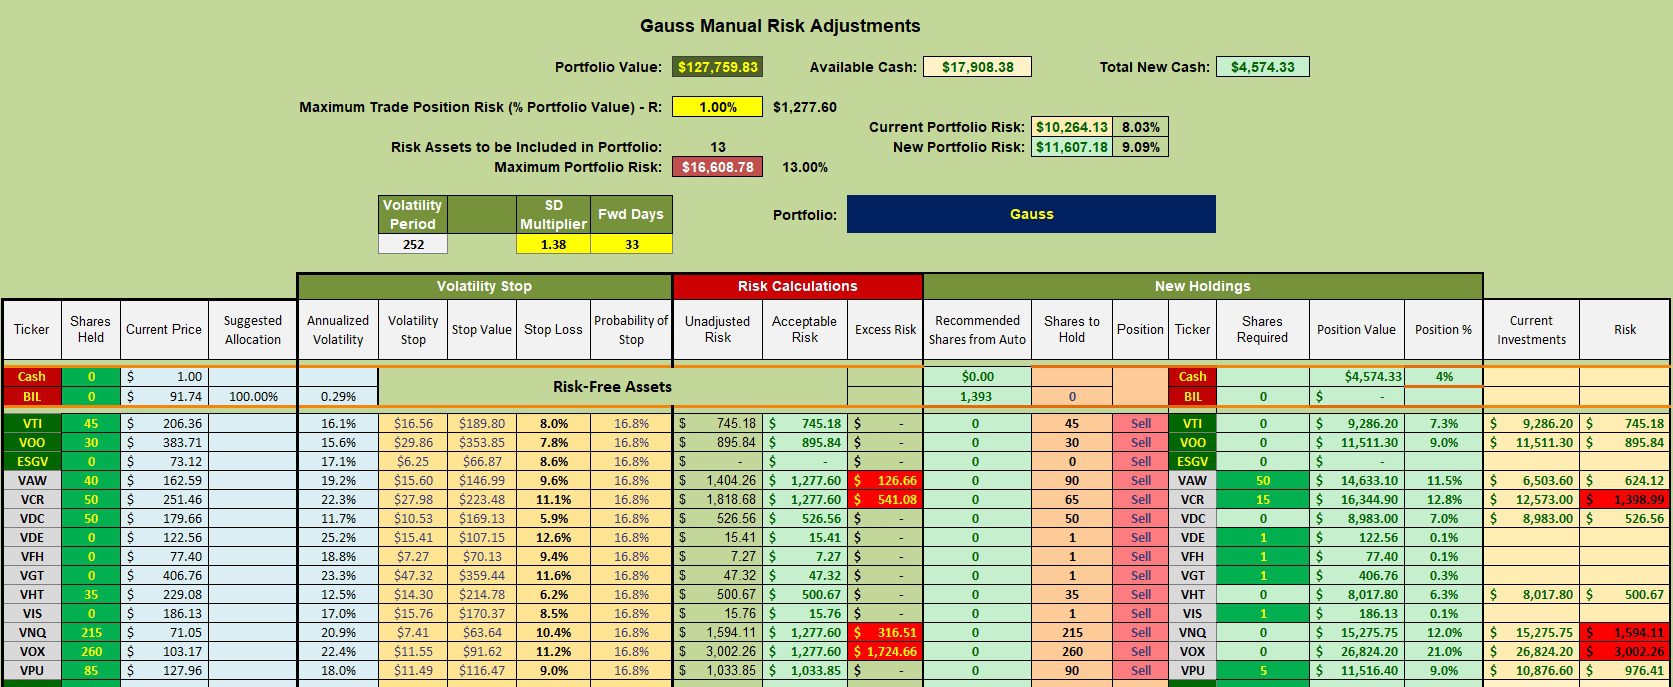
Gauss Manual Risk Adjustments
The Shares to Hold column indicate where I am going with the Gauss. Limit orders are in place to buy or purchase shares of VAW, VCR, VDE, VFH, VGT, VIS, and VPU.
Gauss Performance Data
Since 12/31/2021 the Gauss holds a slight performance edge on SPY, the S&P 500 ETF. The hope is that the oversold sector ETFs will now rise at a faster rate than SPY.

Gauss Risk Ratios
Since September the Jensen Alpha gained a bit of ground. However, it is still negative despite outperforming the benchmark (see Information Ratio).
Another positive signal is the positive slope of the Jensen. The Jensen is frequently called the Jensen Performance Index.

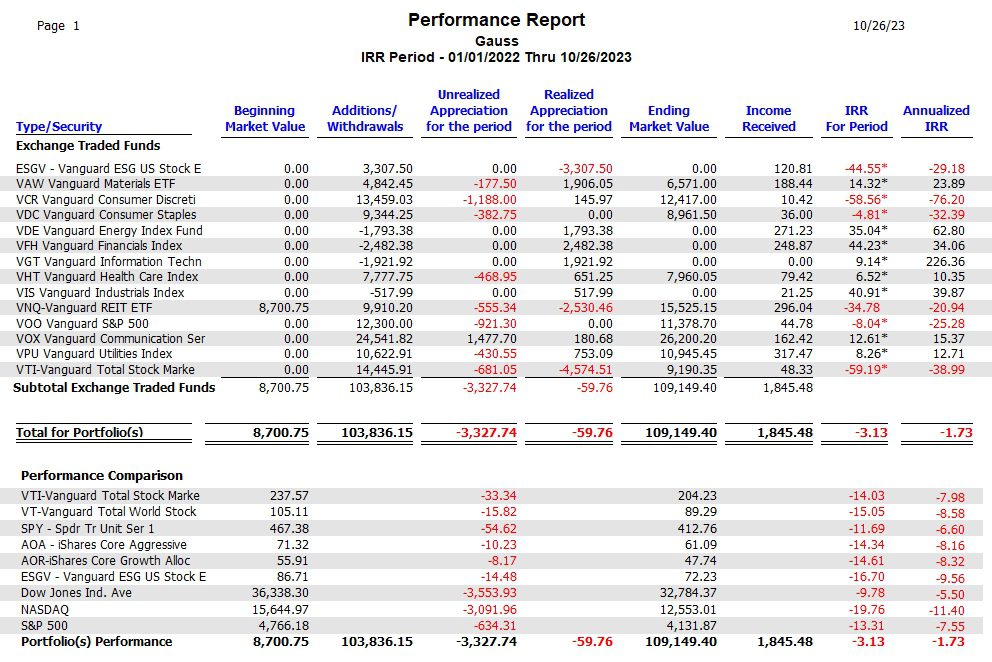
Gauss Portfolio Report
In more recent portfolio reviews I’ve been including the Performance Report is I have sufficient historical data. Look over the following data table. Once more, the total portfolio of the securities in the current investment quiver far outperform the SPY benchmark.
As more history comes into play this table will become more important.
Discover more from ITA Wealth Management
Subscribe to get the latest posts sent to your email.
Hi Lowell,
What percentage out-of- money do you set your buy limit orders? Are they all set at the same percentage?
Thanks,
Hi
Bill
Bill,
I frequently layer the limit orders ranging from 1% below the current price to 5% below the current price.
Considering we may have a government shut-down I then go with the higher percentage. This always runs the risk of missing the buy point.
Lowell
Thanks Lowell