
Organ, St.Peter’s Cathedral, Regensberg, Austria
After last week’s brief period of euphoria, with investor’s thinking that the problems in the Middle East might be over, this week saw a return to reality with a ~2.4% drop in the SPX (S&P 500 Index) and a continuation of the sideways consolidation that has been building over the past two months:
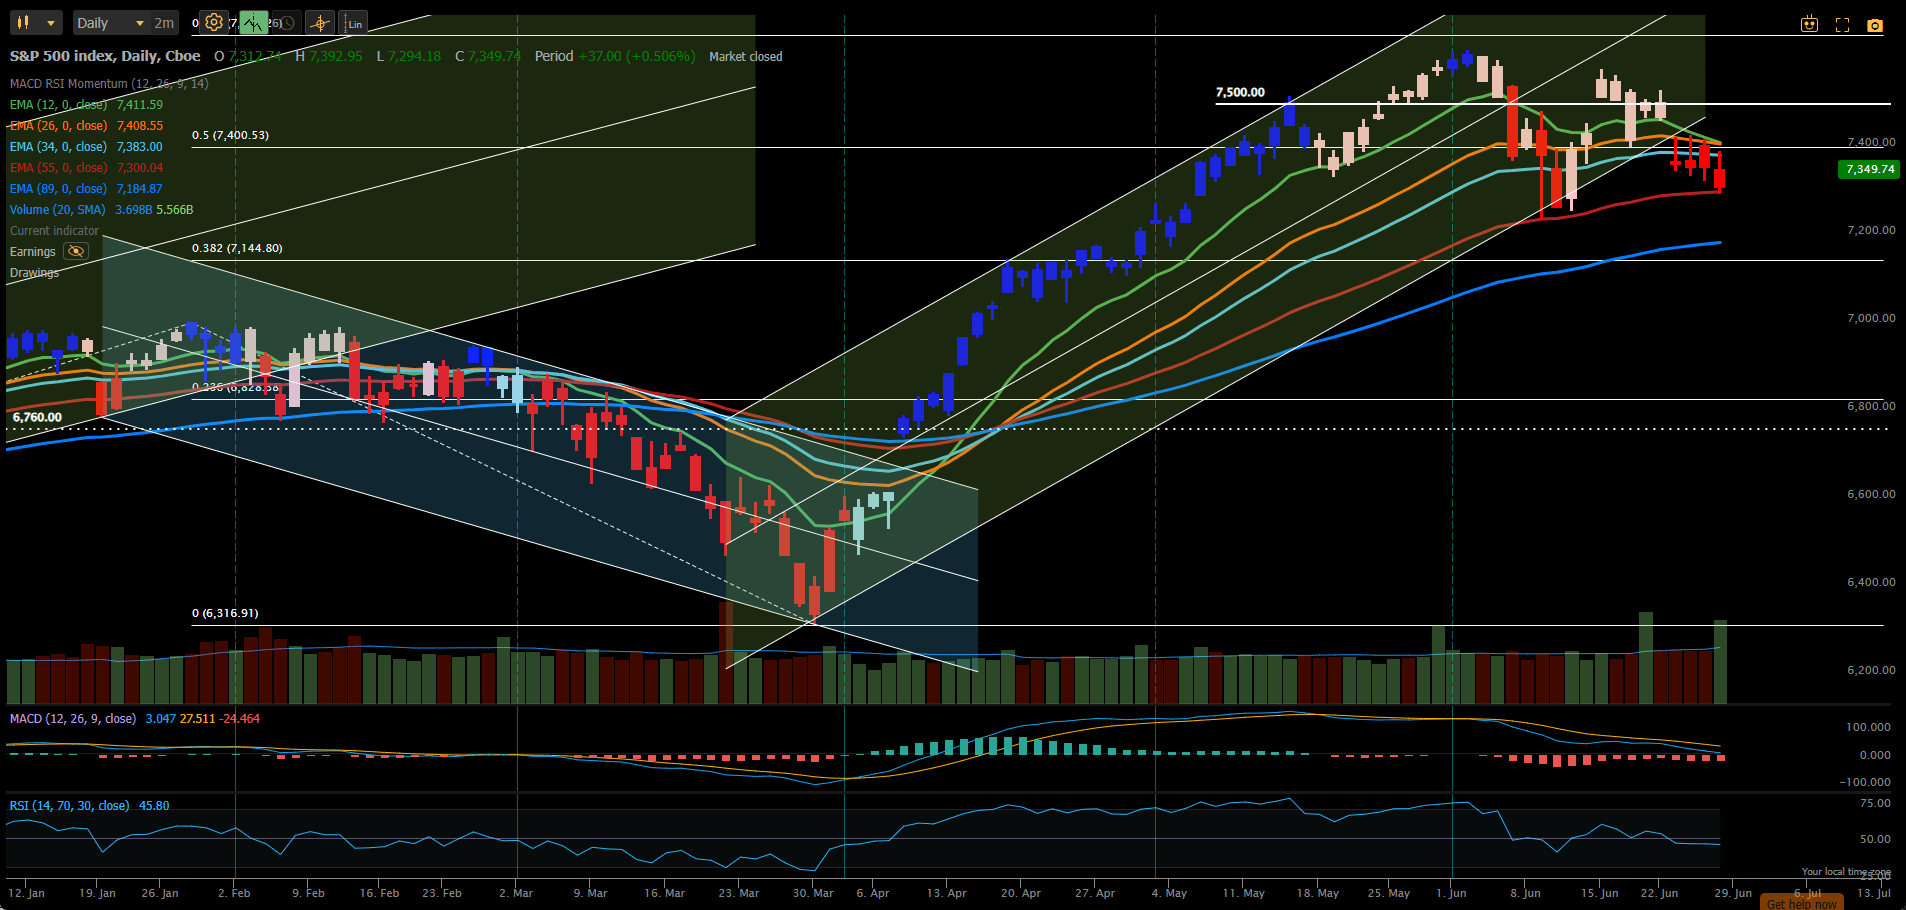
We are now sitting on the 50 Period Exponential Moving Average (EMA) at ~ 7350 and may be dropping out of the bullish uptrend channel – although this cannot be confirmed until we drop below the previous pivot low at ~7250 and head towards the 100-period EMA. We might, just as easily, see a bounce from here and a continuation of the uptrend or, at least a retest of prior resistance levels.
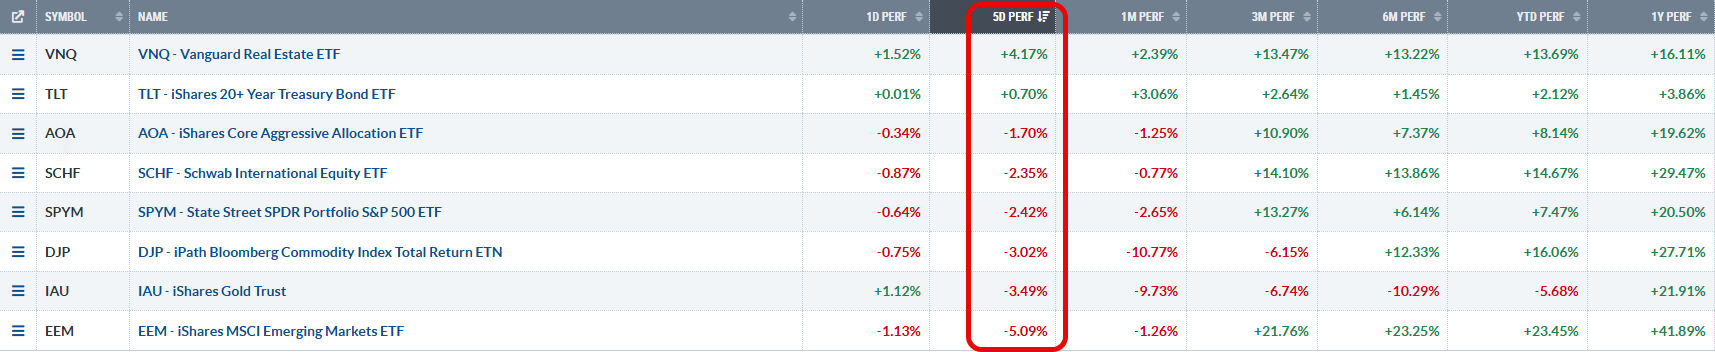
Other Equity markets reacted similarly with Emerging Markets being hardest hit with a ~5% loss. US Real Estate and Treasuries (VNQ and TLT) were the asset classes showing most strength,
These rotations caused me to make 2 adjustments to the Darwin Portfolio this week (red box):
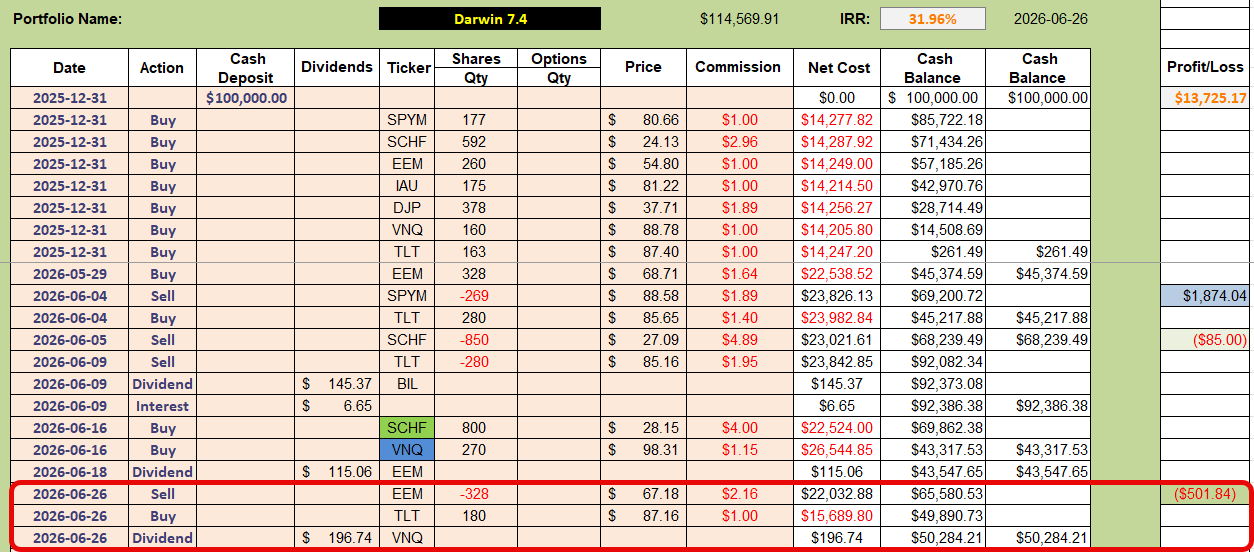 where I sold my position in EEM (Emerging Market Equities) – after picking up the dividend – and replaced it with a position in TLT (US Treasuries). My order to buy shares in TLT was only partially filled (180 out ot 280 ordered) so I will continue to watch this into next week.
The current analysis sheet for the Darwin Portfolio looks like this:
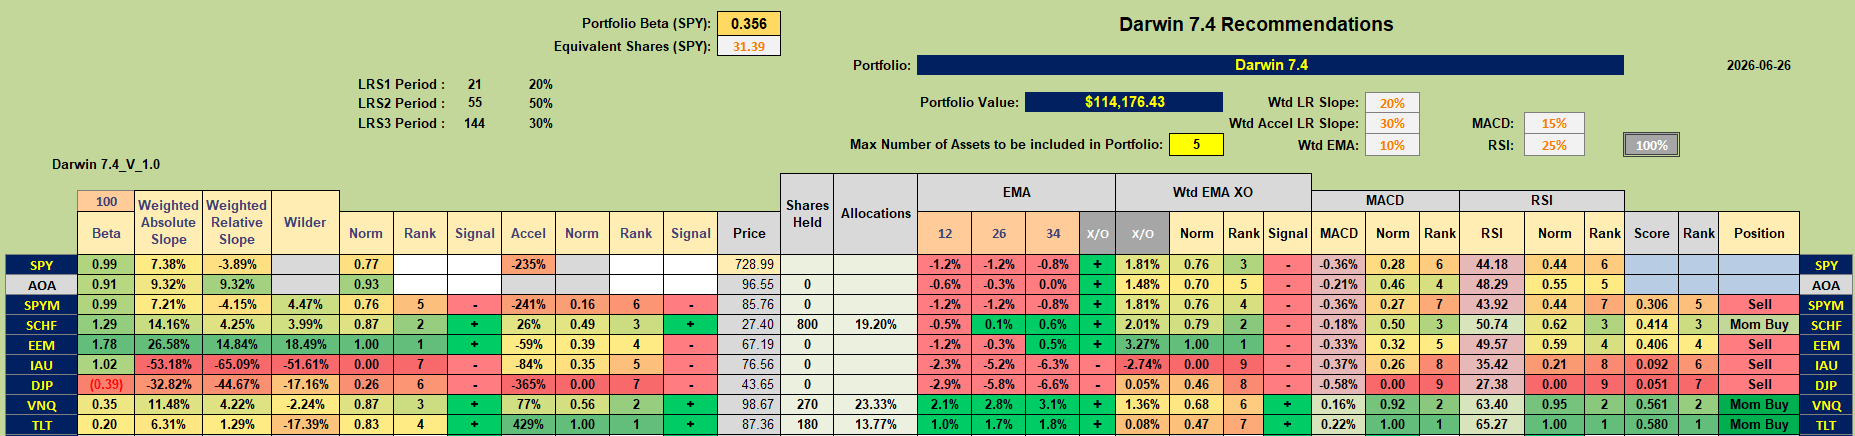 … so I am in reasonable shape apart from allocation levels that are srill sitting below my target 100% fully invested level. However, in this uncertain climate, I am reluctant to increase my allocation level above 25% in any single asset class so I will tread gently.
If we look at the momentum/acceleration charts to see what made me decide to make the adjustments:
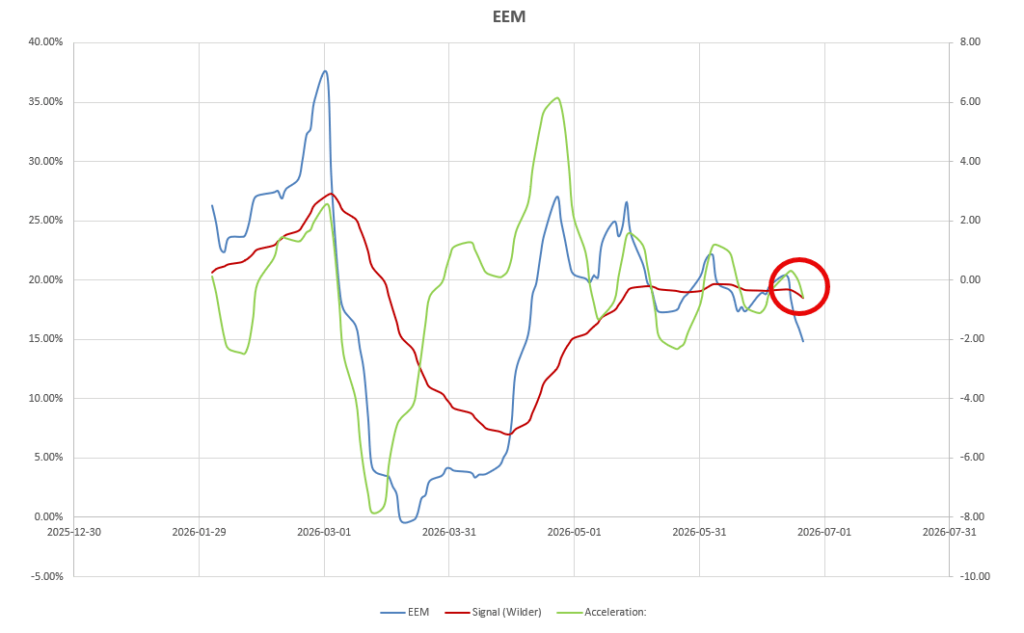 we see that, for EEM, signals flipped quickly (whipsaw) from positive to negative acceleration (green line crossing below zero axis) and momentum (blue line) crossing below its 14-period Wilder Moving Average (brown line).
TLT, on the other hand, showed continued strength:
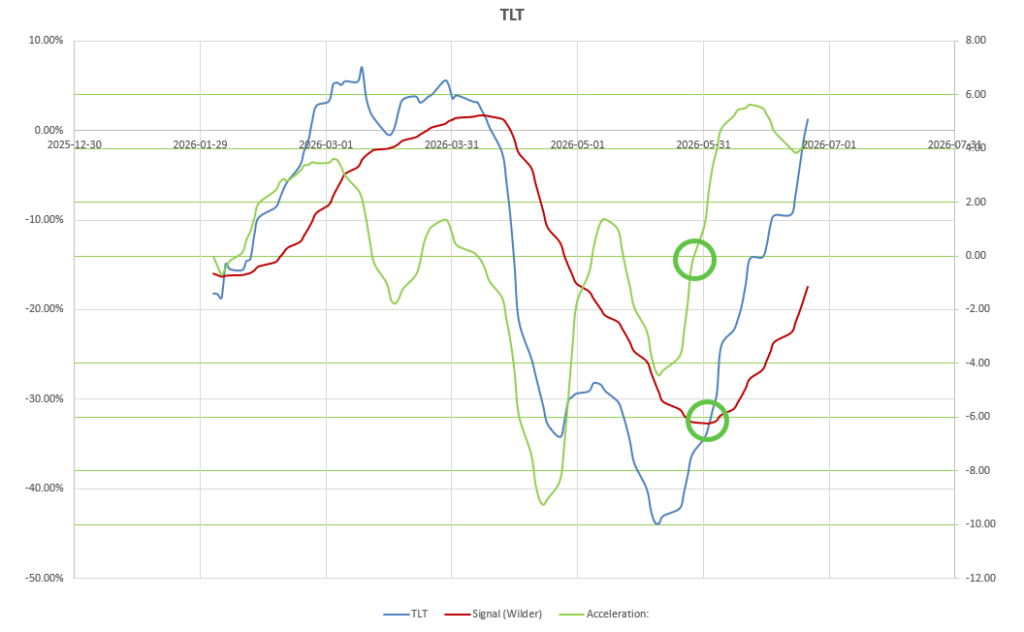 with positive signals for both measurements. With hindsight I should obviously have taken the signals ~1 month earlier on the Mean reversion signals before moving to positive momentum. Here’s the price chart through that period:
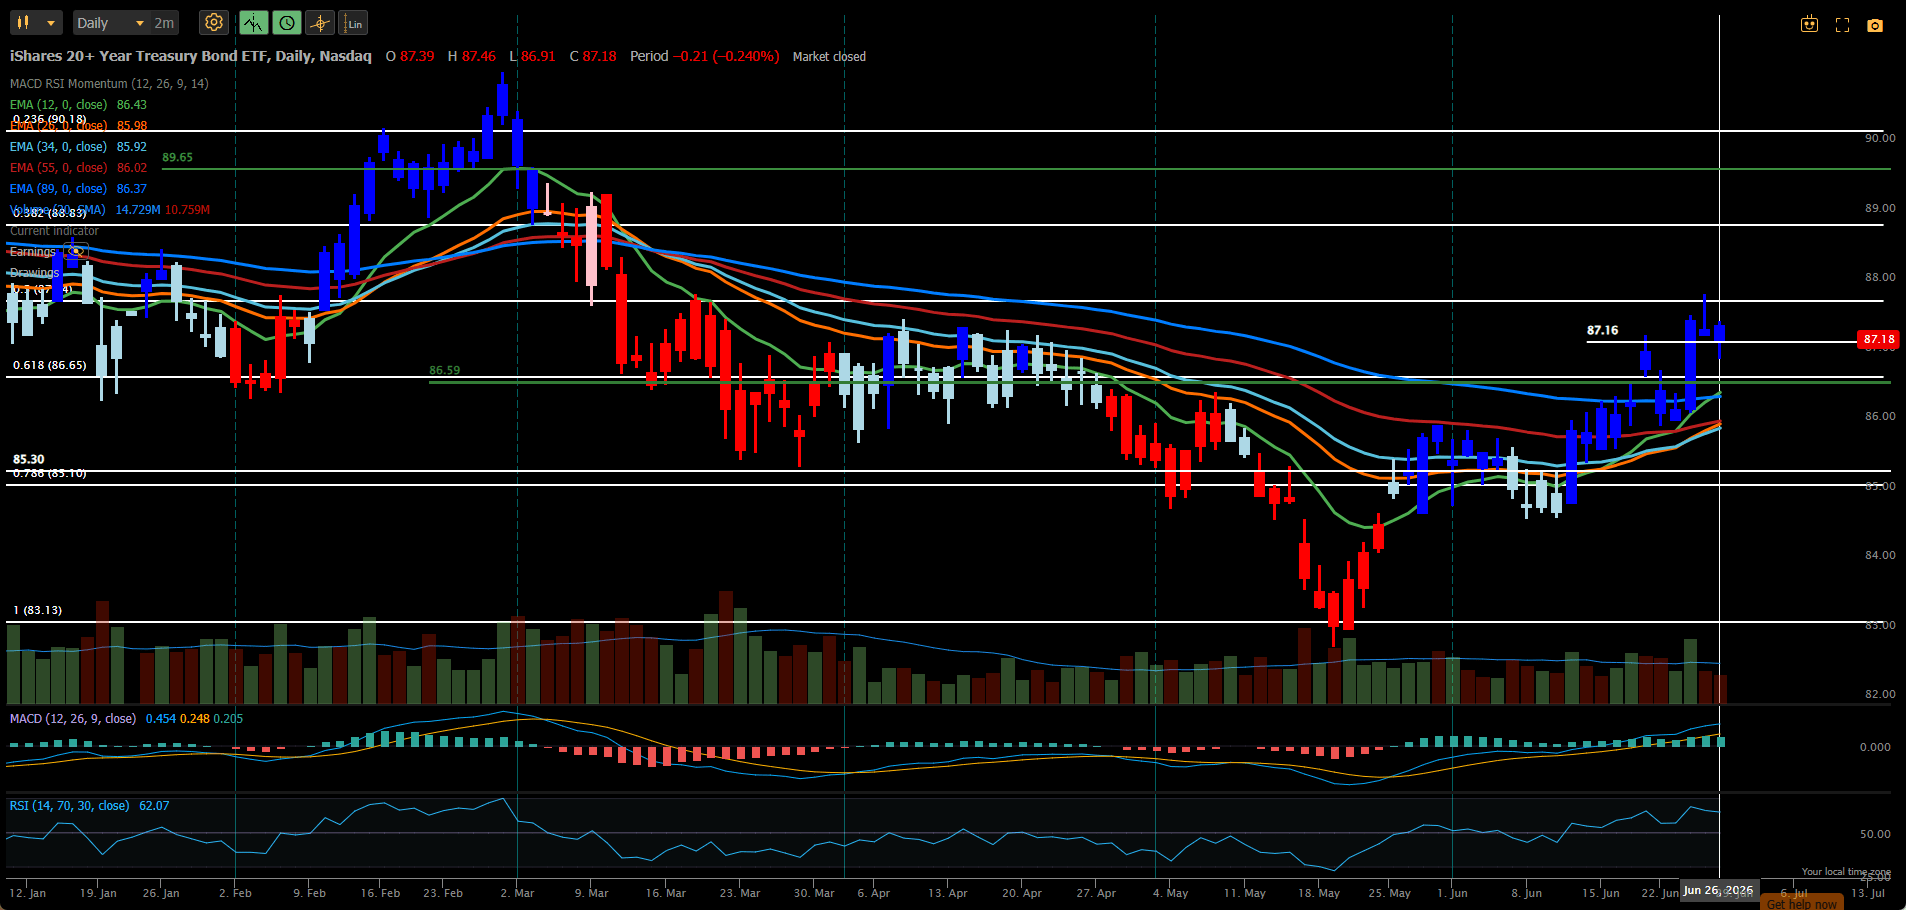 I could easily have entered at ~$85 rather than the current $87 had I taken the mean reversion signal – but I am still in the evaluation stage of assessing the effectiveness of these mean reversion signals. However, to this point they seem pretty good provided that we can accept a few small losses through whipsaw trades.
Performance of the Darwin Portfolio to date looks like this:
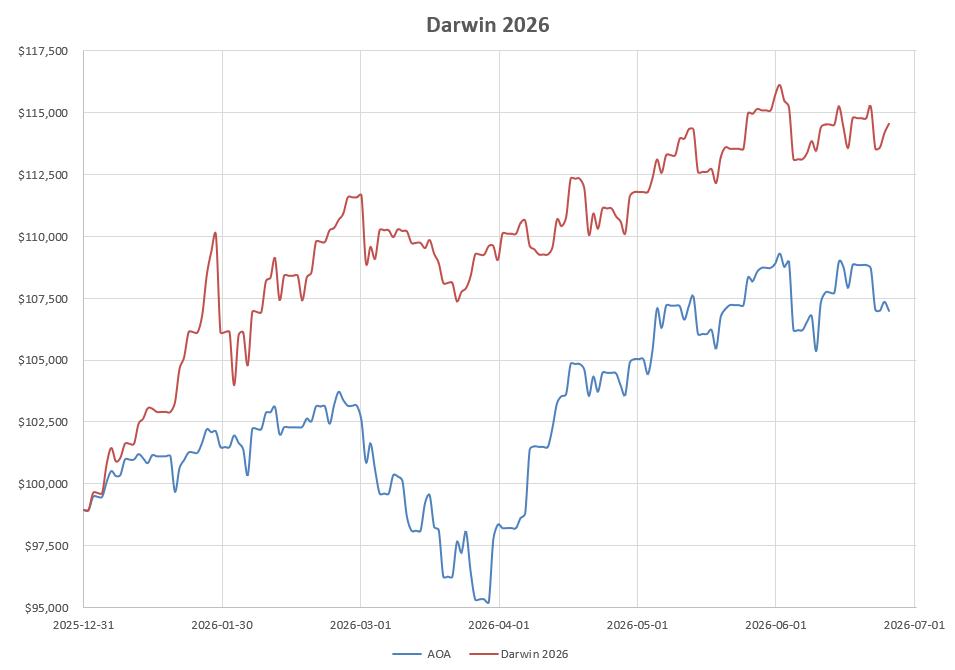 … clearly reflecting the sideways consolidation that we have gone through over the past month or so. We continue to remain ahead of our benchmark AOA Fund.
Discover more from ITA Wealth Management
Subscribe to get the latest posts sent to your email.
Leave a Comment or Question