
Punting on the River, Cambridge, England. This is one way students help pay for their education.
After finally pushing through the 6500 resistance zone and reaching new all-time highs on Thursday, US equities pulled back on Friday to change the week below this level and almost unchanged from last week’s close:
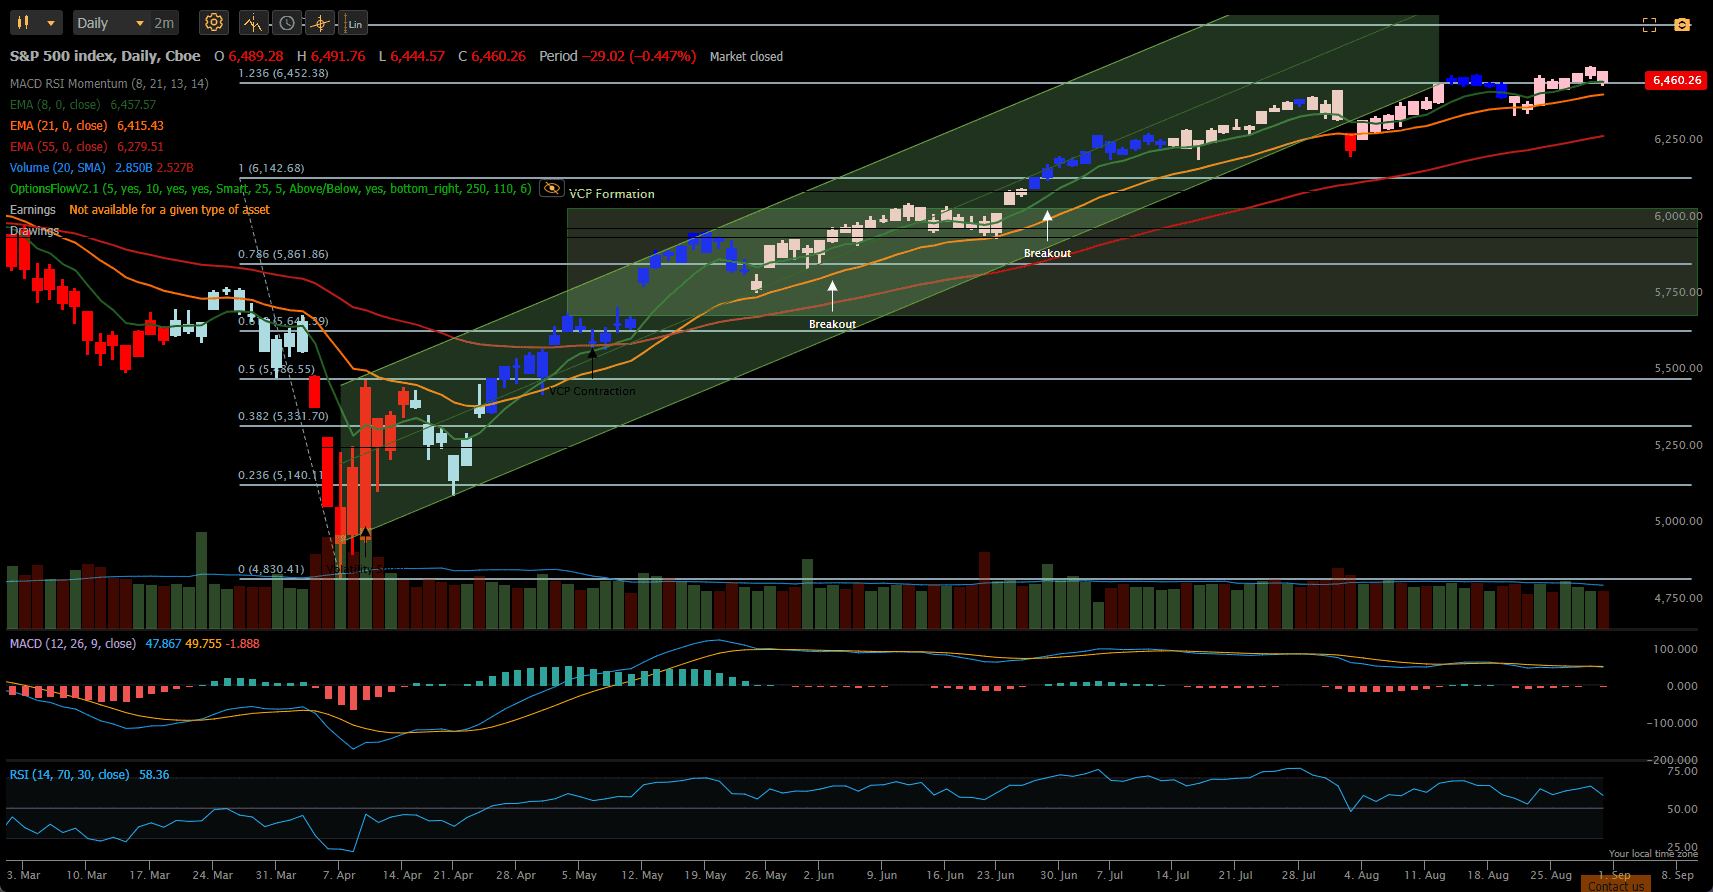 We have now been in a sideways consolidation mode for about three weeks as we go into September – historically the weakest month of the year:
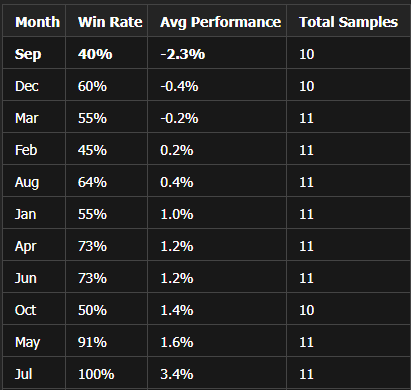 As the above table shows, September has been profitable in only 4 of the past 10 years with an average loss of 2.3%.
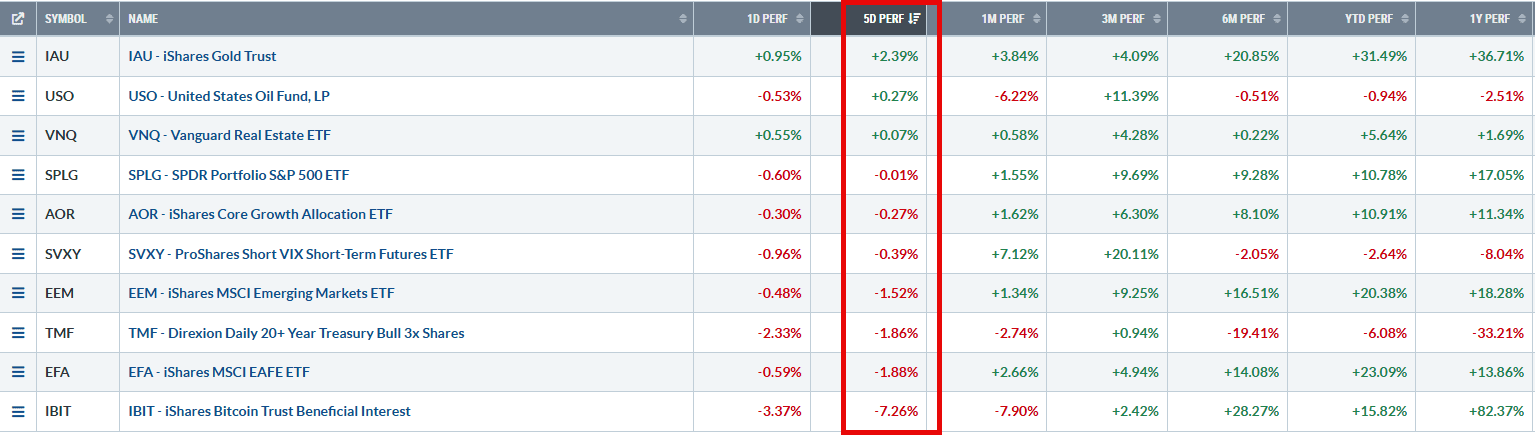
Compared to other major asset classes, US equities performed slightly better than other equity markets but Gold was the strongest asset class with Crypto being the big loser:
I picked up the weakness in Crypto on Monday and closed out the position held in IBIT in the Rutherford-Darwin Portfolio by selling the shares held and buying back the short Call Option sold against them for $6 and keeping the other $104 that I had received in premiums last week:
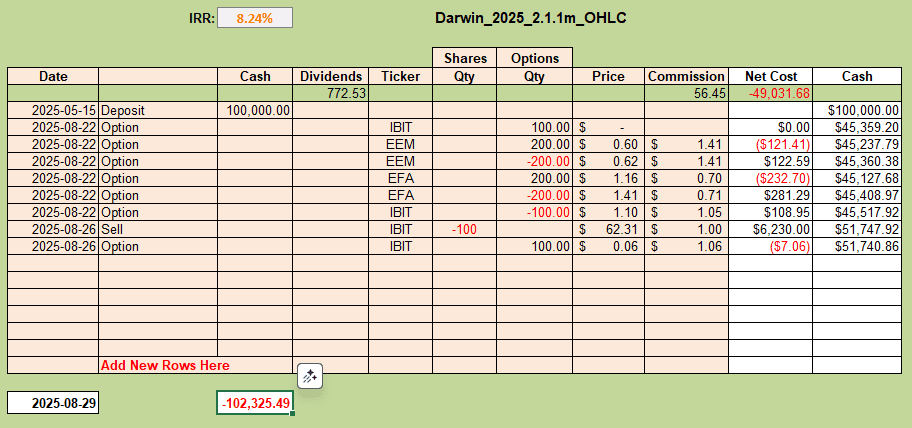 Note that I am less than 50% invested in this portfolio with almost $52,000 sitting in Cash. More on this below.
Checking current rankings and recommendations from the Kipling workbook:
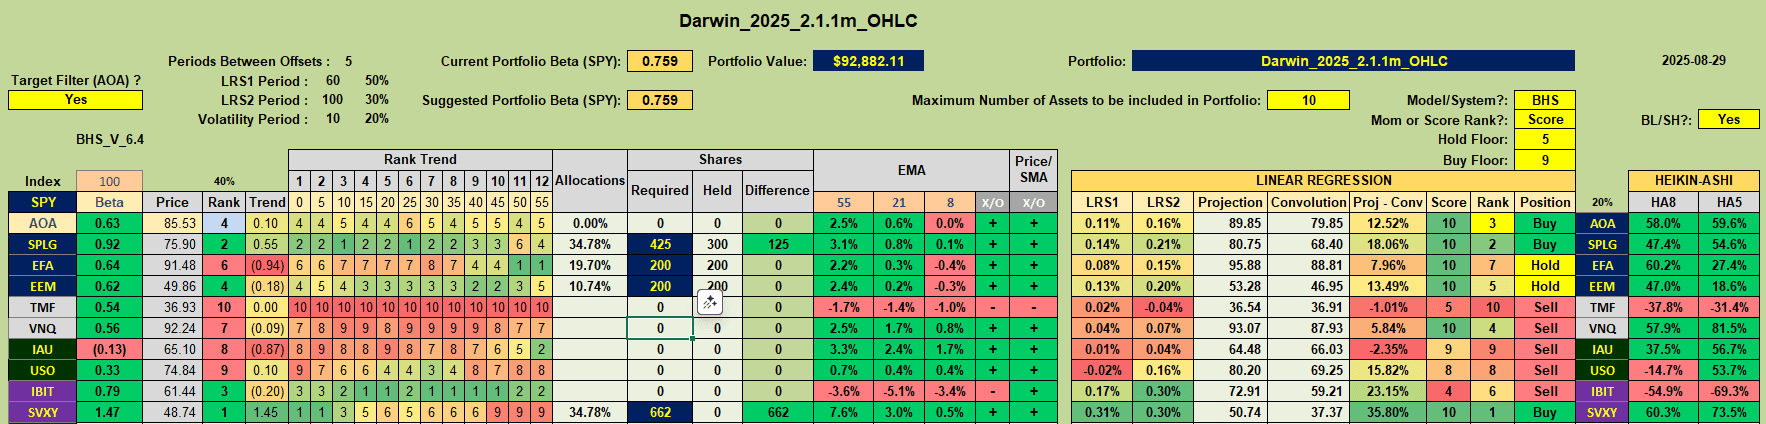 we see that SPLG, EFA and EEM are recommended Buys or Holds with the Benchmark AOA Fund also showing as a Buy. SVXY still remains as a Buy recommendation – and I probably should have followed the suggestions of the model – but I am still wary to buy this inverse volatility ETF with volatility presently at relatively low levels. I will wait until volatility increases (which it will do if we get a strong pullback/correction from the current high stock price levels). Volatility is far more predictable than stock prices.
In terms of current hedge positions we see the following picture:
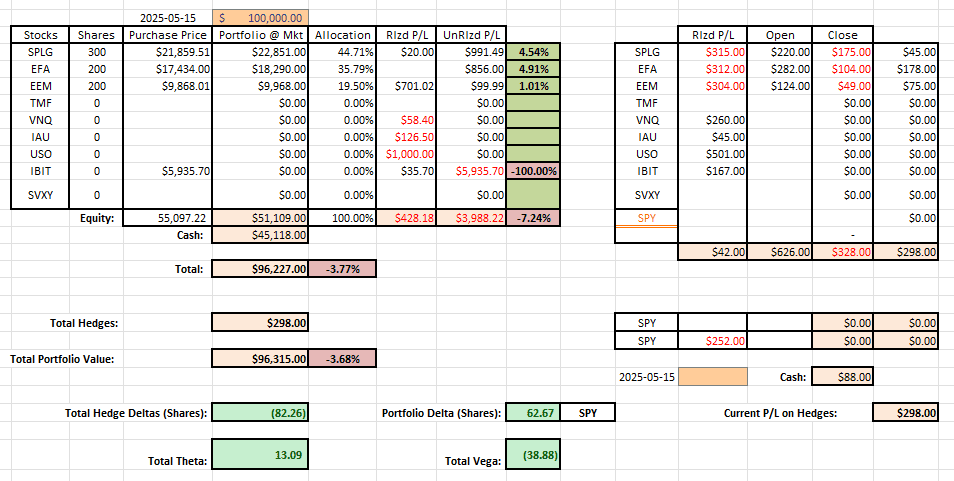
with the portfolio being slightly over-hedged – negative 82 SPY-equivalent shares from the sale of Options versus positive 63 SPY-equivalent shares of assets held. This is based on Beta weighting of the ETFs held in the portfolio.
The impact of this over-hedging is to flatten the performance curve and reduce returns:
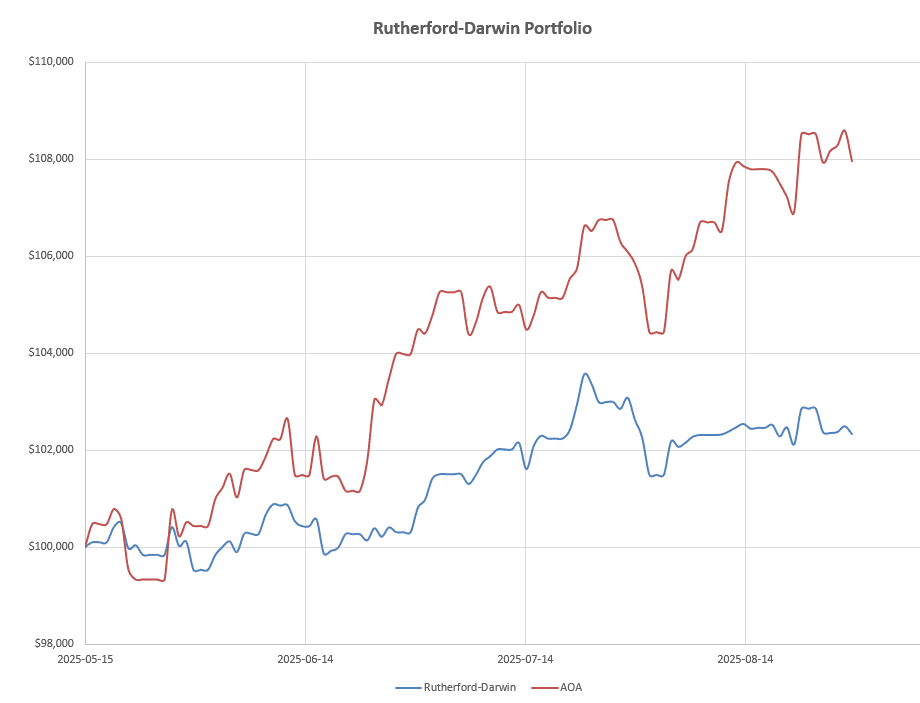 although it does have the impact of significantly reducing volatility – 4.7% for the portfolio versus 8.5% for the benchmark AOR Fund.
Note that the returns from the portfolio are significantly lower than those of the benchmark Fund – but that is primarily due to the fact that it is assumed that 100% of available funds are invested in the benchmark whereas only 50% has been invested in the portfolio. I was careful when I set up the portfolio since I wasn’t sure how many ETFs might be held in the portfolio at any one time. I therefore assumed that 10 ETFs might be held and that a 2% volatility per asset might lead to 10 x 2% = 20% maximum volatility – although, due to diversification, more likey ~60% of this or ~12% volatility. Experience to date is suggesting that only 3-5 ETFs are likely to be held and volatility is less than 50% of this 12% target (4.7%) – therefore I will likely increase the per asset volatility level to 4% from the current 2% level. This should mean that I can invest more of the available funds and push the equity curve higher whilst remaining well within my volatility (risk) targets. In anticipation of a weak seasonal market for equities I am comfortable being a little over-hedged.
Discover more from ITA Wealth Management
Subscribe to get the latest posts sent to your email.
Leave a Comment or Question