
Eastern Shore near Ocean City, Maryland.
McClintock is one of four Dual Momentum™ portfolios tracked here at ITA Wealth Management. Is this investing model doing an adequate job for the owner of this portfolio? Follow along as I walk through the review or updating process. If there are new readers who are not familiar with the Dual Momentum model, it is an investing model built on the foundation of the market anomaly, momentum. Gary Antonacci is the developer of the Dual Momentum model and one can learn all the details found in his book by the same name. Unfortunately, the book is expensive so I’ve distilled the essentials in this Seeking Alpha article. There are currently over 50 blogs on this site related to this model where most relate to specific portfolios using the DM investing model.
Antonacci recommends using a one-year look-back period when using the Dual Momentum (DM) model. With the McClintock, I am using a 100- and 252-trading days combination so the McClintock operates close to Antonacci’s recommendation.
If you are using the Kipling spreadsheet, the DM investing model is built into the spreadsheet. There are three other investing models in addition to the DM model. All the investor needs to do is set the Kipling to the DM model, adjust the look-back periods, and download current prices. The spreadsheet then informs the investor what decisions are required. I review DM portfolios every 33 days so as to move the review to different days of the week. I also avoid the wash-rule when buy and sell decisions come close together. Rapid trading rarely happens as trades occur only one or two times a year when using the longer look-back periods.
McClintock Dual Momentum Recommendation
What is the DM model for the McClintock currently recommending? As you can see in the screenshot below, the McClintock holds 50 shares in ESGV and the recommendation is to sell those shares. I plan to set a TSLO at 5% to sell all 50 shares. If you are mechanically using the DM model, sell all shares today.

McClintock Performance Data
Long-time readers know that the McClintock is one of three DM portfolios participating in a look-back experiment. The Franklin uses a relative short look-back combination while the Pauling is operating as Antonacci recommends with a one-year look-back. The McClintock fits in between with a middle ground look-back combination.
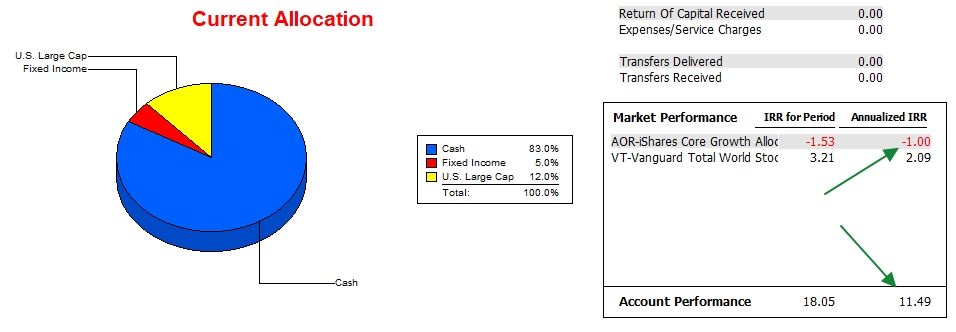
The Franklin was launched in late November of 2020 and that is why 11/30/2020 is used as the starting period for all portfolios I track. This permits fair comparisons. Since 11/30/2020 the McClintock returned 11.5% while the AOR benchmark lost 1.0%. Vanguard’s Total World Stock Fund grew at an annualized rate of 2.1%. The DM model is serving this owner extremely well. This data comes from the commercial software, Investment Account Manager.
McClintock Risk Ratios
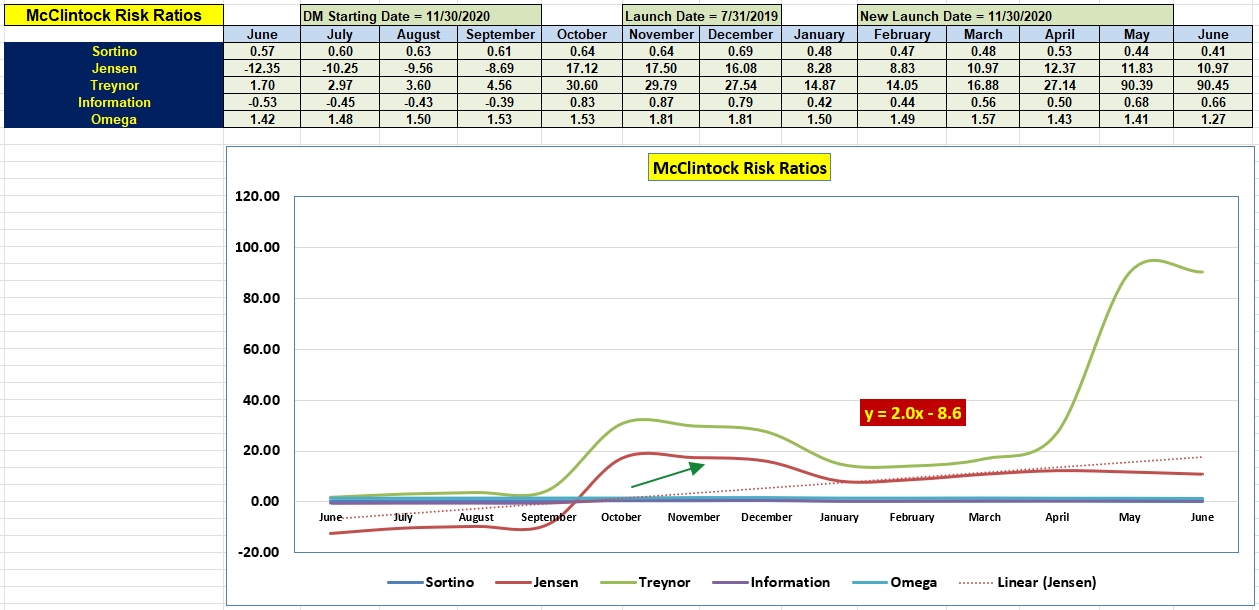
How is the McClintock performing when risk enters the equation? A drop in the Sortino Ratio shows the McClintock is growing at a slower rate than it was last year at this time. Jensen’s Alpha, also known as the Jensen Performance Index is still an extremely high 10.97. This is much improved since June of 2021, despite the rise in the risk-free interest rate.
As stated many times, the Treynor Ratio is impacted by the portfolio beta and the current 0.119 value drives the Treynor to very high levels. The Jensen, while beta is part of the calculation, is impacted far less by beta movements and therefore is the preferred risk calculation.
The current slope (2.0) of the Jensen is very high and will certainly decrease once the negative values from last summer clear the data table. As for the Information Ratio, positive numbers are telling us the portfolio is outperforming its benchmark.
ITA is now free to all investors who sign up as a Guest. There are a few blogs still reserved for Lifetime members. Sometime next week I plan to post a blog showing the performance of the 16 portfolios tracked here at ITA Wealth Management. This performance data does not include those portfolios tracked by Hedgehunter.
Discover more from ITA Wealth Management
Subscribe to get the latest posts sent to your email.
I set a TSLO at 2.5% to sell 50 shares of ESGV. Contrary to DM modeling, I set numerous limit orders to buy back ESGV. These limit orders were set anywhere from 5% to 30% below the current price.
Lowell