
Wild Orchids, Indonesia
It was a bullish week in the US Equity Markets with the SPX (S&P 500 Index) gaining 4.6% on the week. There was also some sector rotation that required adjustments to the Dirac portfolio in an attempt to stay ahead of the broader market. Checking the analysis sheet at the end of the week the picture looked like this:
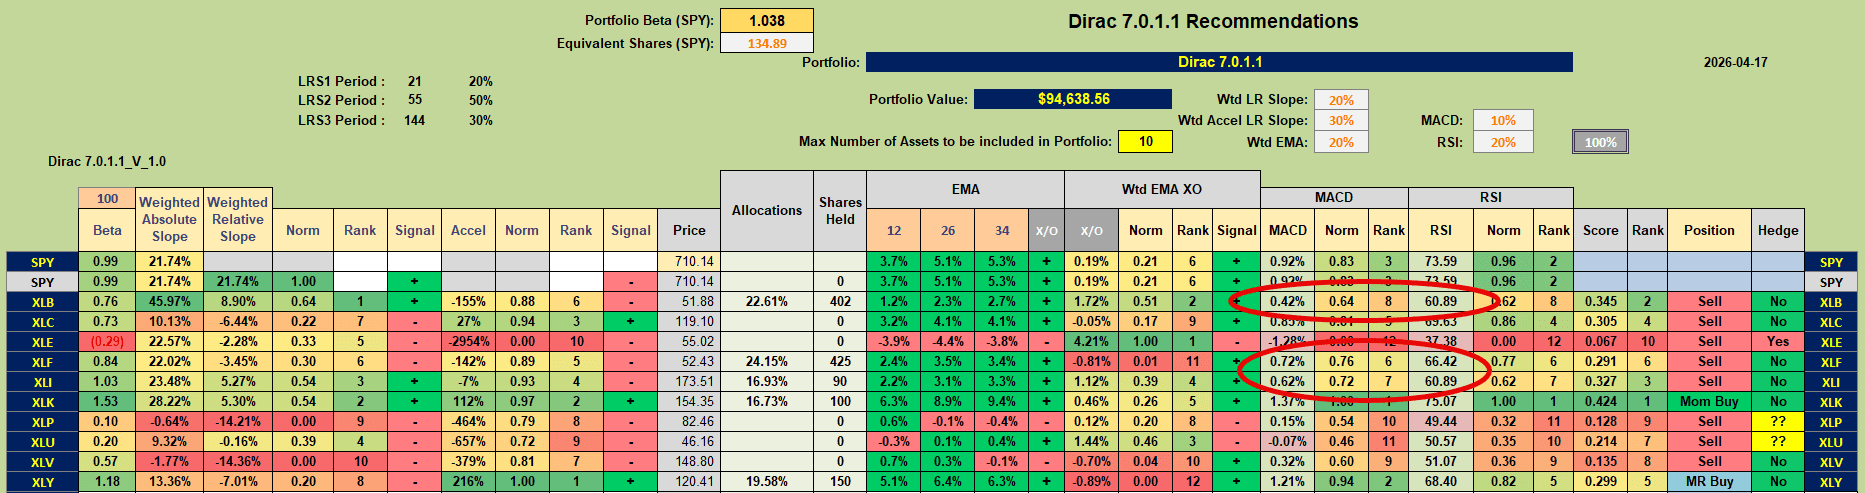
with only two Buy recommendations – a Momentum Buy recommendation for XLK (Technology) and a Mean Reversion (bottom fishing) Buy signal for XLY (Consumer Discretionary). All other sector ETFs are flashing Sell signals – although the short-term indicators (MACD and RSI) are still positive (Red elliptical boxes). We will have to wait to see whether this picture is flashing a warning signal or whether the short-term strength will prevail.
At the beginning of the week, the portfolio was holding positions in XLB, XLF, XLI, XLU and XLV – all of which are presently showing Sell recommendations – so let’s take a look at some of the momentum/acceleration graphs:
The picture for XLU (Utilities) looks like this:
 where we see negative crossovers for acceleration (green line) and momentum (blue line) with both heading south. XLU was sold out of the portfolio on Monday.
Similarly, XLV looks like this:
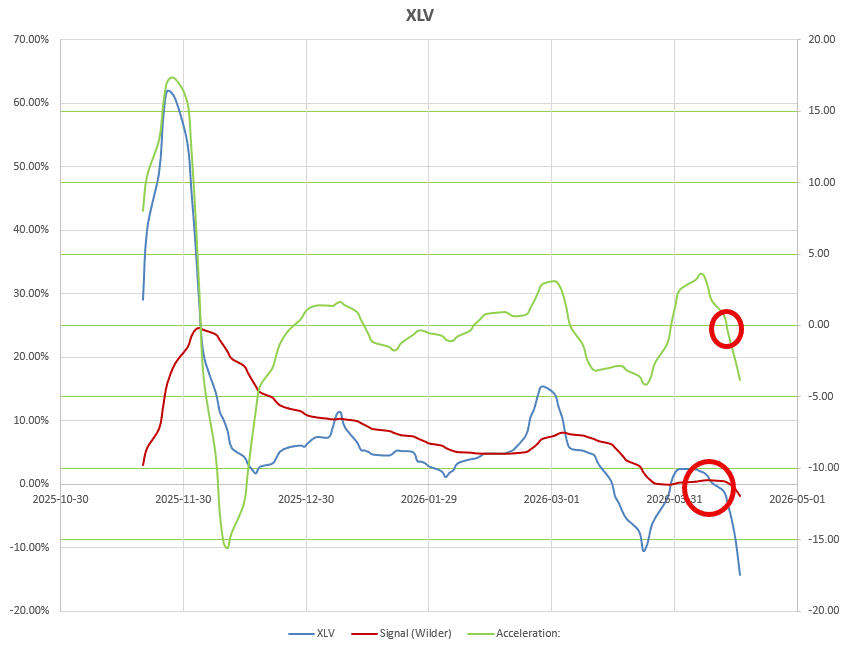 and shares in this ETF were sold out of the portfolio on Wednesday. Both of these sales resulted in small losses ($55 for XLU and $29 for XLV) – but nothing too worrisome apart from the trading friction.
Positions in these two ETFs were replaced by positions in XLY:
 that generated a Mean Reversion Buy signal with a crossing of momentum above it’s 14-period moving average and positive acceleration. Relative momentum is still negative relative to SPY so we are “bottom fishing” here.
…. and XLK:
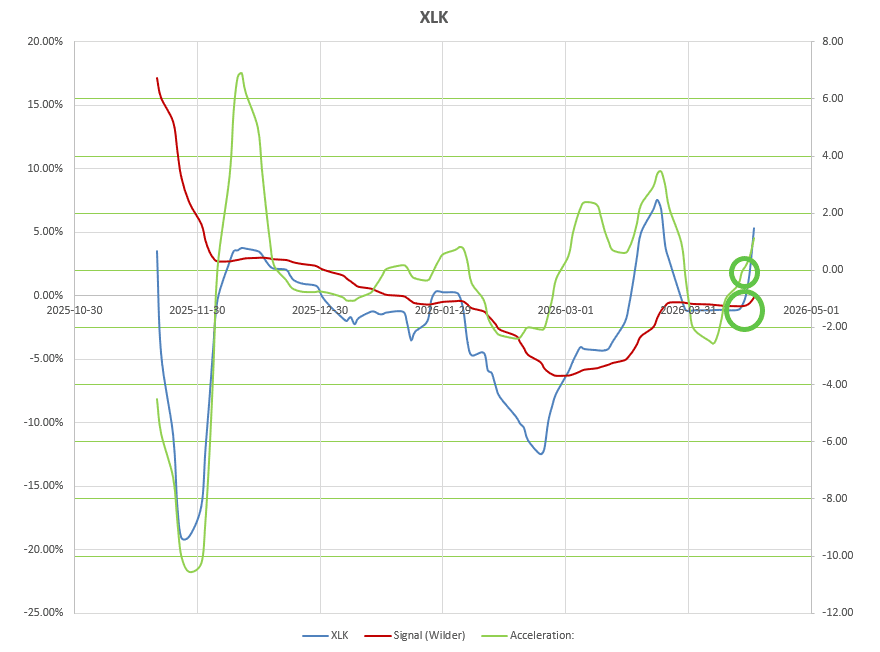 ….. showing similar positive movement.
Trades this week look like this (red box):
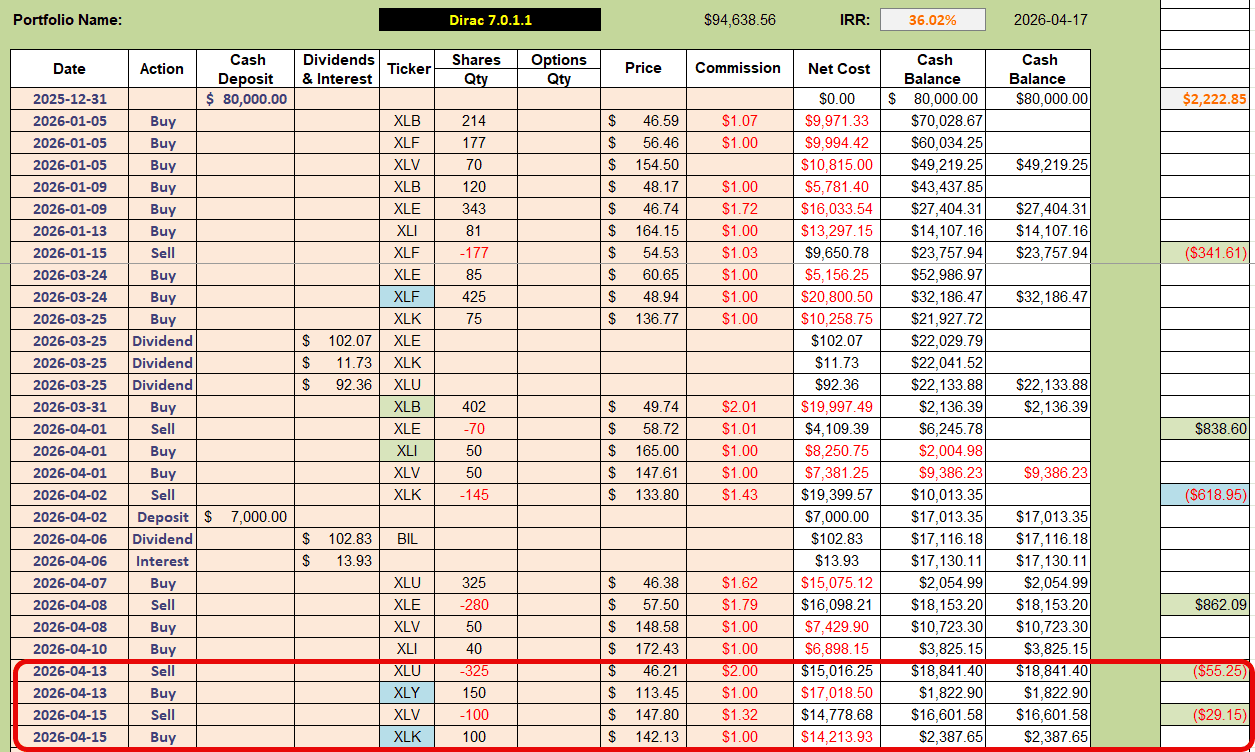 and leaves me with positions in XLI, XLF and XLB that are all presently generating Sell recommendations.
So, Let’s take a look at the momentum/acceleration graphs for these ETFs to see what actions might be called for next week.
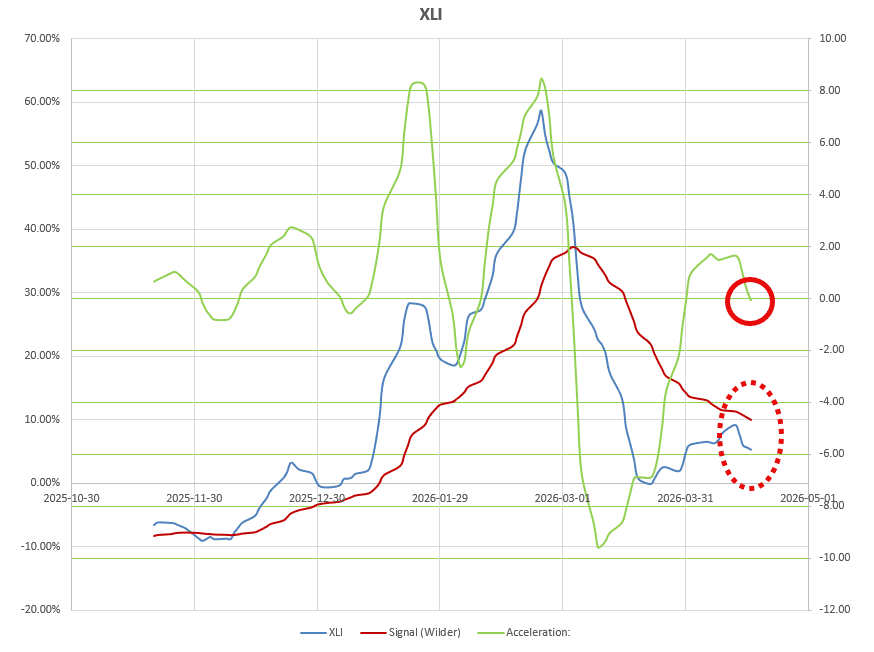
For XLI (Industrials) acceleration has just (on Friday) turned negative and, although momentum (relative to the broader market as represented by SPY) is still positive, it is sitting below it’s 14-period Wilder MA – so this is a strong contender for being removed from the portfolio early next week unless short-term momentum (MACD and RSI) is maintained.
 XLB (Materials) is looking like this:
 …. again suggesting a Sell unless short-term strength is confirmed.
Finally, XLF (Financials):
 … although maybe not quite as compelling until momentum crosses below it’s 14-period Wilder moving average, is also a serious candidate for removal from the portfolio.
Present holdings look like this:
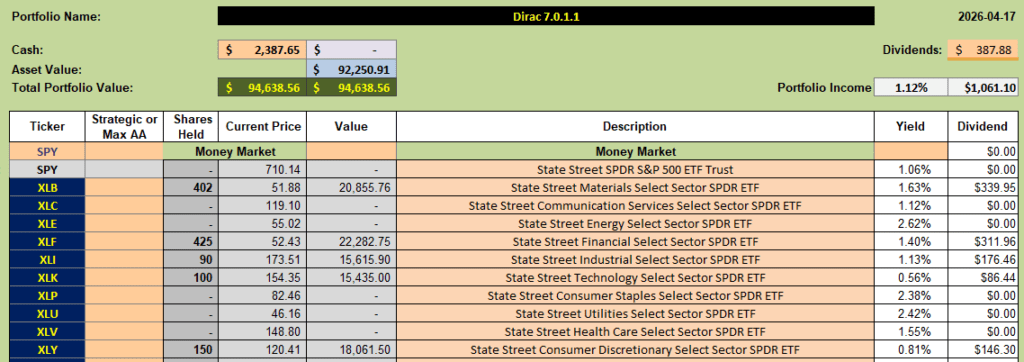
that are reasonably well balanced/allocated and close to fully invested with probable adjustments likely to be called for in the next week.
This is quite a bit of trading, as compared to more moderate “investor” actions, but is probably necessary if the goal is to try to beat the performance of the broader market (SPY) as money flows/rotates from one sector to another.
Comparative performance to date looks like this:
 where we are still outperforming the benchmark Year-To-Date (18% return vs 12.5%). The most significant feature here is that over-weighting the Energy Sector through March was definitely beneficial, although it hurt a little going into April as equities surged ahead in terms of generating more positive returns. Although this may be too much “active trading” for most “investors” (preferring less frequent adjustments) I believe it is probably necessary in order to achieve the goal of beating the performance of the broader market – otherwise probably better to just “Buy and Hold” the broader market, with less frequent checks, and exit only when it becomes more obvious that there is a change in trend – but this probably means accepting more volatility and larger draw-downs.
As a reminder, I will just mention that this portfolio was hedged (using Options) for downside risk protection on 12 May as the SPX broke below support at ~6800. As prices dropped to ~6300 (~-7%) the hedge increased in value to show ~$3,000 unrealized gain – with $7,000 possible at today’s (17 April) expiration should prices have stayed at those lows. With the recent recovery, and movement to new highs, it turns out that the hedge was not required and (after adjustments) the Options expired with a $314 gain. The objective of a hedge is not to make money but to protect a portfolio and reduce losses – just like home or auto insurance – but it is nice when one can squeeze a little money out of something that was not required 🙂
Discover more from ITA Wealth Management
Subscribe to get the latest posts sent to your email.
I have closed positions in XLB (Materials) and XLF (Financials) in the Dirac Portfolio. This locks in ~$2,000 profit. XLI (Industrials) is also still signaling a sell but, since it is one of the few sectors that is up today I have not sold it. More details in the week-end review.
This morning I sold my position in XLI (Industrials) with $358 Profit and added shares to my existing positions in XLK (Technology) and XLY (Consumer Discretionary) that are my only 2 current holdings. I am also holding ~33% of the Portfolio Value in Cash (BIL). More explanations in the weekly review this weekend.