
Helleborus closeup – perennial flower
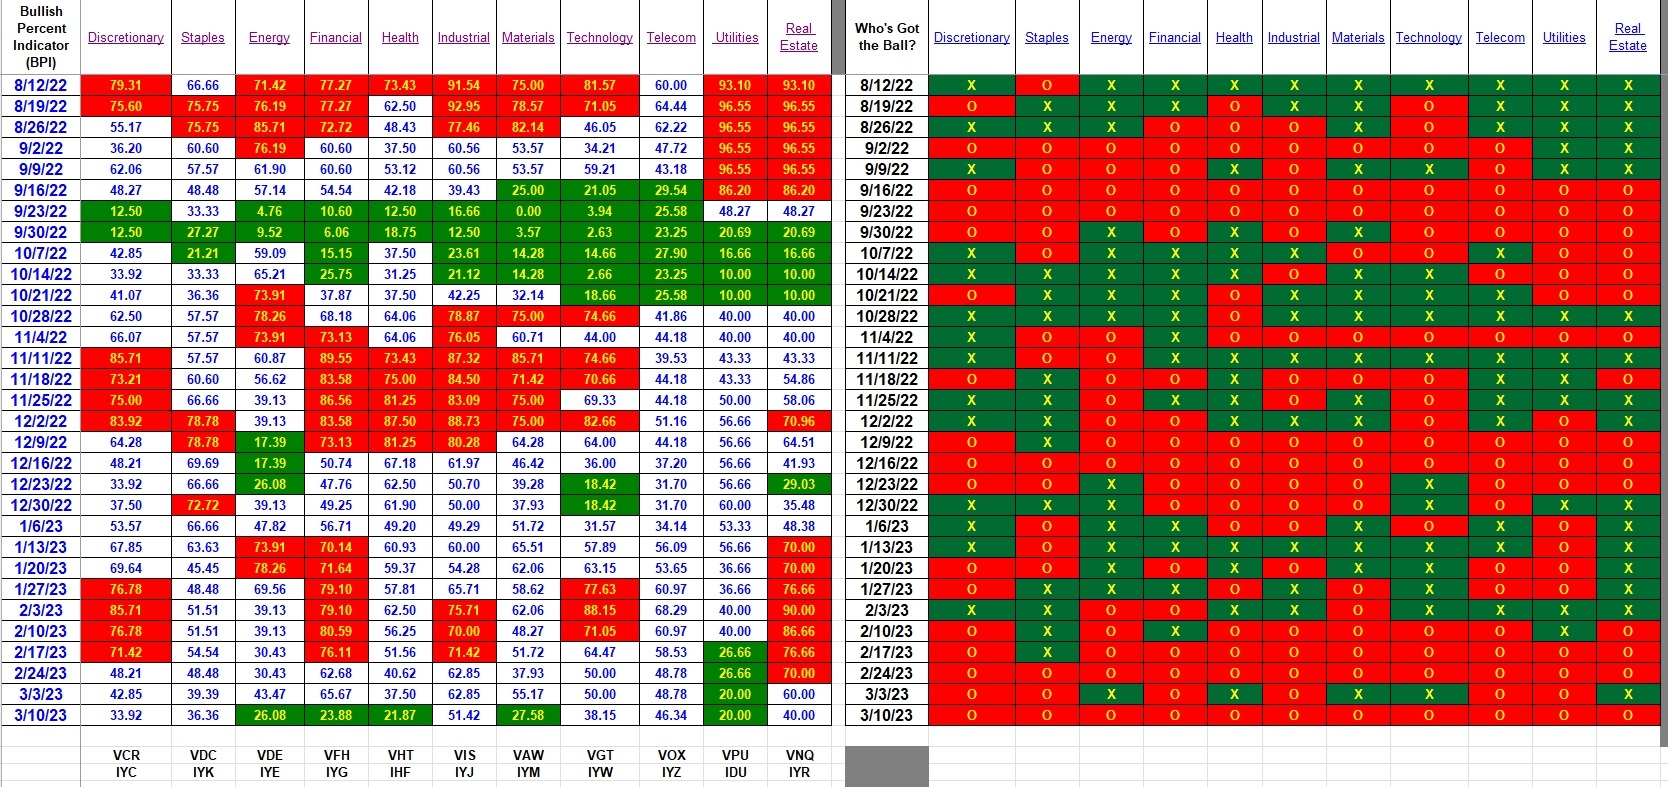
Collapse of the Silicon Valley Bank, continuation of high inflation, strong employment numbers, and the threat of default on the debt limit all rattled the stock market this week. Two major indexes and four more sectors moved into the over-sold zone. Utilities (VPU) was already over-sold. Call this action the first move of the sector cycle and the first real opportunity to begin testing the Sector BPI model.
Index BPI
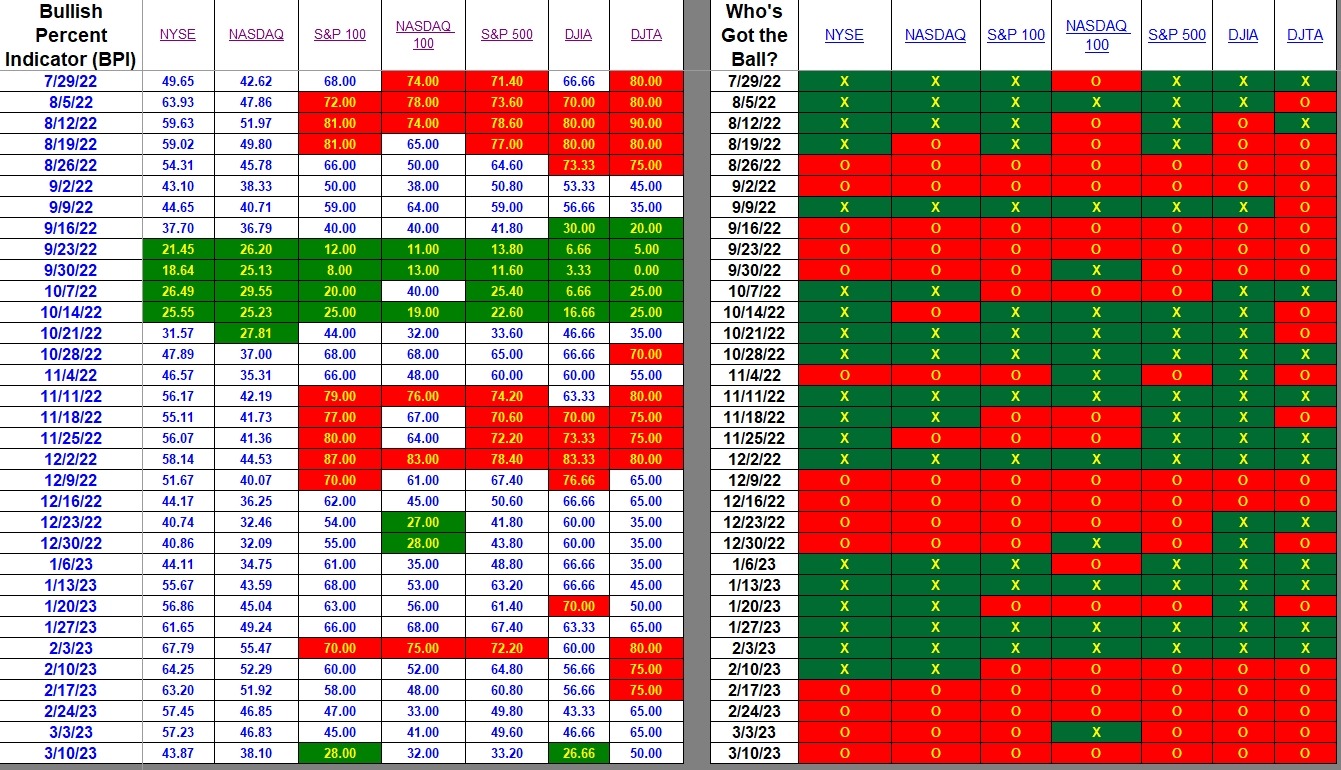
The following table of equity indexes shows particular weakness in large-cap stocks. This is why we see the S&P 100 and Dow Jones Industrial Average positioned in the over-sold zone. Over-sold is defined when 30% or fewer of the stocks within the index exhibit bullish signals when examined through the lens of a Point and Figure (PnF) graph.
Sector BPI
And now for the BPI sectors or information we use to manage the four Sector BPI portfolios. Five of the eleven sectors are over-sold. Later today I’ll use one of the Sector BPI portfolio as an example as to how to manage these five over-sold sectors.
While all sectors are bearish, as we can see from the right-hand section of the table, we are more interested in the individual percentages. I’ll need to wait until I’m working with a particular portfolio to see if the recommended percentages in these five sectors top 100%. If this happens to be the case I’ll fill up the most volatile sectors first as those are the sectors most likely to quickly move up into the over-bought zone. Over-bought is defined when 70% or more stocks within a sector are bullish when viewed using PnF graphs or charts.
While I don’t enjoy market declines as we experienced this past week, I am quite interested to see how this action might lead to eventual profits from Sector BPI portfolios. Once positions in the over-sold sectors is in place, be prepared to wait many months before we see and sell signals.
Explaining the Hypothesis of the Sector BPI Model
Discover more from ITA Wealth Management
Subscribe to get the latest posts sent to your email.
Lowell,
In the spirit of developing the BPI methodology it looks as if waiting for the true <30% signal would have produced a lower entry price of VDE and VHT. I bought these both when they were very close to 30%, ~31%. VDE subsequently had a decent profit a few weeks later, VHT has not been in the black. My VDE positions is currently 1.8% in the red and VHT 4.6% in the red. I do plan to add VFH and VAW to my test portfolios. Just sharing my experience in the current market:^ ) BTW I will watch VFH carefully before entering as the financial sector is especially volatile after the SVB diaster.
Bob W.
Bob W.,
I’ll need to check to see if I picked up shares of VDE and at what price. When Energy dipped close to the 30% level I placed limit orders at a lower price thinking the Energy sector would be below the 30% line when the limit price was struck.
Lowell
If you looked at the sectors today (March 13) you would see the intraday value of Energy at 8.7%! In my bullish percent P&F charts, ALL of the sectors are on O’s.
Tom Dorsey (of Dorsey-Wright) recommends watching the bullish percents turn up onto X’s before initiating positions.
Craig,
Correct. Your Energy percentage matches mine.
I just updated the BPI spreadsheet and I see where Utilities turned bullish. The remaining ten sectors are bearish.
The same five sectors are still in the over-sold zone. I’ll be looking at the Millikan tomorrow.
Lowell
Lowell,
Just a thought. A significant current risk is that the market will continue to decline, including those sectors already in the over-sold category. I have been thinking about how to use the Kipling spreadsheet to help set an entry point. In particular, I’ve been thinking about using the HA signals. An entry point would be when some combination of the Short-term and Long-term HA’s become positive (3/5, 5/8, or some other confirmation). That way I can mitigate the risk of purchasing a sector while it is still in decline. Even if after purchasing based on the HA signals the market again retreats, my thoughts are that you still would have purchased at a lower price than if you had not used the HA signals to help establish when to purchase.
The HA signals would not be used to “manage” the portfolio or to set Sell signals, but only used in establishing when to purchase over-sold sectors.
Thoughts.
~jim
Jim,
What are HA indicators?
By the way, you have other confirmatory opinions about using the absolute value of the sector bullish percents as a buy/sell signal. Dorsey-Wright (see comment above) recommend buying AFTER the bullish percents turn around into being on the offensive (in a column of X’s)–this is after dropping below 30% or so.
Waiting for the turn-up (6% total on a standard 3-box P&F reversal, each bullish percent box being 2%) is the typical recommendation.
It’s an imprecise art we are dealing with 🙂
Craig
Craig,
The HAs are the Heiken-Ashi indicators in the Kipling spreadsheet. See the Menu and Tranche sheets.
~jim
“Dorsey-Wright (see comment above) recommend buying AFTER the bullish percents turn around into being on the offensive (in a column of X’s)–this is after dropping below 30% or so.”
Craig et al.,
Adding this additional wrinkle to the Sector BPI model of waiting for the PnF graph to turn positive or show an X in the right-hand column may not be a bad idea. One can assume it is not possible to pick the very bottom so be a little more patient and wait for the PnF to turn as Utilities did today.
Lowell
Lowell,
You are right! I see the utilities sector has reversed today. Good catch.
Craig
This way of waiting for the reversal could also potentially work on the over-bought side too. In fact, Dorsey Wright recommend that once you hit such values, either a complete exit or a major position trimming should be in the works.
Jim,
I have not been using the HA. If I recall correctly, when I was following the three different models available within the Kipling (HA, BHS, & LRPC), the HA was the poorest performing model. I’m not trying to discourage you from applying your approach as described above.
One thing I’ve been doing is to delay fully populating a position as soon as the sector drops into the over-sold zone. Rather, I’ve been using a series of limit orders – each priced a little lower than the prior limit order. In other words, ladder the purchase orders. In years past I would not take this approach as commissions would eat up any potential advantages.
Another approach is to break the Sector BPI portfolio into segments so one is not buying all positions on the same day.
Lowell
Readers:
If Dorsey uses PnF graphs to manage individual stocks, I wonder how he determines what percentage to invest in each company. Perhaps he follows 10 to 20 and invests equal percentages in each.
Lowell
Lowell:
Tom Dorsey does not explicitly discuss position sizing in the books I have. He seems to imply using a form of relative strength for position sizing.
My favorite is using risk parity, which is dependent upon the historical volatility of an equity (or sector). You can use any number of measures, but I typically use a 20-bar average true range (ATR). You can also use standard deviations, Bollinger Band width (essentially the same as the std dev of the closes). You then define what amount of your portfolio you want to risk, and you divide that by the volatility measure to determine the number of shares. This type of anti-Martingale position sizing was promoted by The Turtles (The Original Turtle Rules) and also by Van Tharp in several of his books.
If you do not want to have such a dynamic view of near-term risk, you can always use the multi-year beta of the sectors (with respect to the S&P 500, or SPY) to determine portfolio position sizing. Over time that will also change, but you can probably get away with doing that on an annual basis.
I hope this helps.
Craig
I was incorrect about the anti-Martingale equation I discussed. Here is the correct equation, using XLK as the example:
#shares = (portfolio risk fraction * total funds for portfolio)/(volatility measure)
I typically use the 20-bar ATR. Using a $100K portfolio, with 0.25% risk units ($250), and the current daily XLK ATR(20) = 2.91
#shares = (0.0025 * $100K)/2.91 = 85.91 –> 85 shares
At the current XLK price of 138.73, the total position cost would be $11,792, or about 11.8% of the total portfolio value. You can adjust the risk units as you see fit.
Lowell:
If you want to compute the position percentage via the beta route, you would essentially compute the ‘partition function’ of the inverse betas.
Each individual value would be computed in a similar manner. For example, XLK (Technology Select Sector) currently has a 5-year beta of 1.15 (via Yahoo Finance).
XLK portfolio % = (1/1.15)/(Sum(all sector beta inverses))
You would rebalance as needed.
Hope this helps.
Craig
I just updated the BPI spreadsheet and readers can add Discretionary (VCR) and Industrial (VIS) to the list of over-sold sectors. Utilities (VPU) moved from over-sold into the neutral zone so we now have six over-sold sectors.
The Franklin is the next Sector BPI portfolio up for review. Franklin might be a test when it comes to dividing the available cash into this many sectors.
One solution is to change the coefficient (currently 0.70), thereby reducing the percentage allocated or recommended for the different sectors.
Lowell