
Jungle Dwelling in Peru
This is a special blog post for two reasons.
- The new asset allocation for the Bohr is designed to resist the coming recession. Check the low beta value.
- At the bottom of the page is the most coherent explanation of why current withdrawal requests from private equity companies is placing so much stress on the U.S. Equities market. At the very end of this useful video is an explanation of how revaluing the price of gold could move America out of the debt crisis.
Sign up as a Guest if you wish to read all the critical information included in this blog post. Then wait for me to elevate you to the Platinum level so you can read all available material.
Bohr Asset Allocation Holdings
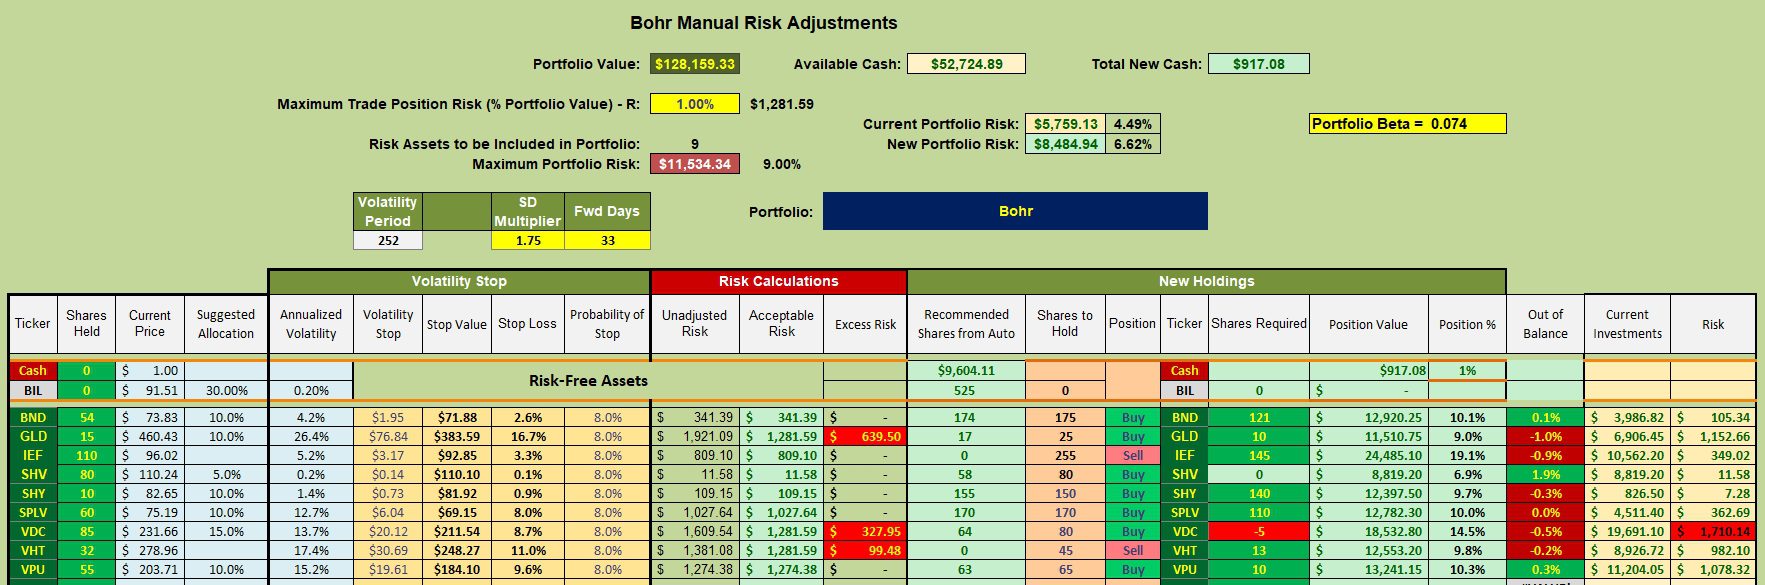
Below is the new asset allocation for the Bohr. While all nine ETFs representing different asset classes are shown, most of the ETFs are not close to their recommended target percentage. That will come as the limit orders are struck over the next few weeks.

Bohr Rebalancing Recommendations
The ninth column from the right shows the number of shares that will bring the different asset classes into balance. When fully populated the Bohr should generate approximately 2.5% annually in dividends.
Bohr Performance Data
The light blue section of the pie contains most of the U.S. Treasury ETFs. Not sure why the IAM software does not pick up the specific identification.
The Bohr lagged the AOR benchmark since the launch date of 12/31/2021.

Bohr Risk Ratios
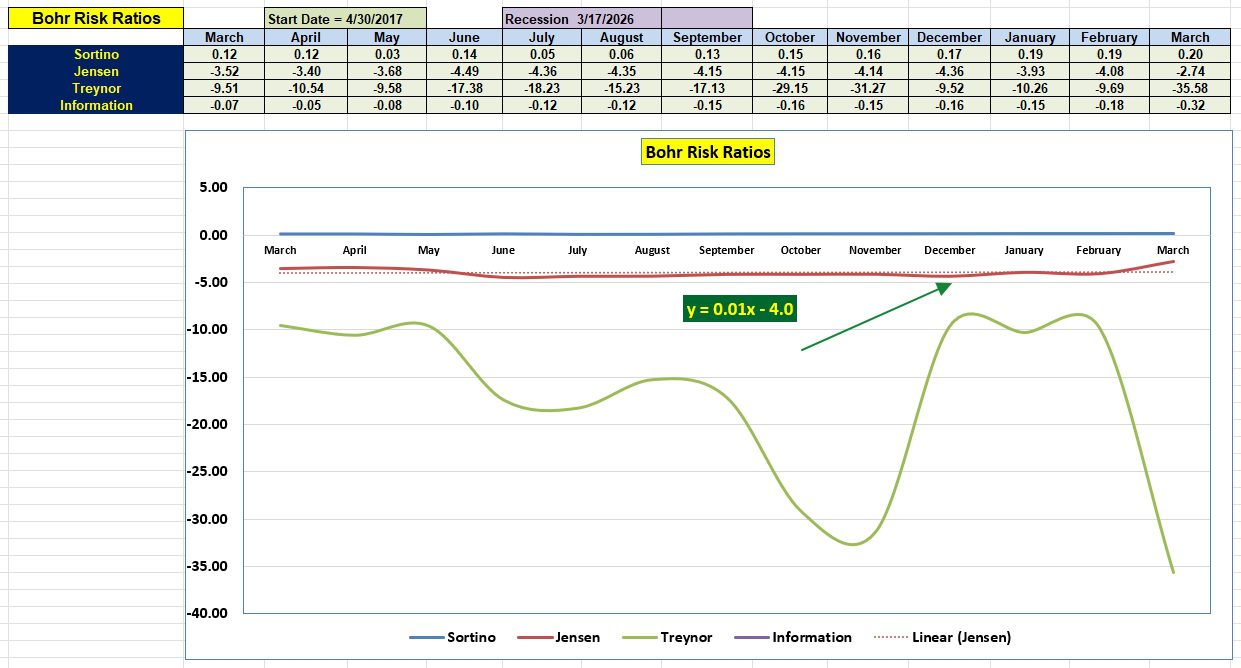
Over the next few months we will check to see how this low risk portfolio performs against a basic benchmark. The Jensen Alpha is showing some improvement and that is encouraging. Over the past year the slope of the Jensen has been essentially flat.
What is going on with the Treynor? Check the above screenshot and you will see the portfolio beta is a very low 0.074. Very low beta values exacerbates the Treynor. A low portfolio beta combined with a negative IRR value pushes the Treynor into deep negative territory. The primary reason I am not a huge fan of the Treynor Ratio is that it is so driven by the portfolio value. Pay most attention to the Jensen Performance Index and the Information Ratio.
Now click on the video at the bottom of the page for some very useful information. Let me know if the link does not work.
Discover more from ITA Wealth Management
Subscribe to get the latest posts sent to your email.
Not happy with the video. In ’69, I first took Econ 101. So, by the early 70’s, I had some understanding of what Nixon was attempting with price controls, gold price manipulation, then ending the gold standard. I also recall how Volker fought stagflation and high inflation by raising interest rates to where financing a home would have been cheaper with an 18% credit card than with a conventional mortgage. We might soon face stagflation and/or an ’08 level “Great Recession.” However, I lean toward reversion to the mean rather than the fear sold by this peddler.
Lee,
I’m not sure if the author of the video is actually supporting increasing the value/price of gold or explaining a way the government might manipulate the national debt. There is no question that Individual-1 has exacerbated the national debt problem – and it is a huge problem.
Lowell
I agree.
Lee et al.,
The author of the video might have mention that going back to a tax structure of 1960 is another alternative to balancing the budget and working down the national debt.
Lowell