
Botanic Gardens, Singapore
The pullback in US Equities continued this week as prices broke below the lower boundary of the bullish trend channel that started in April:
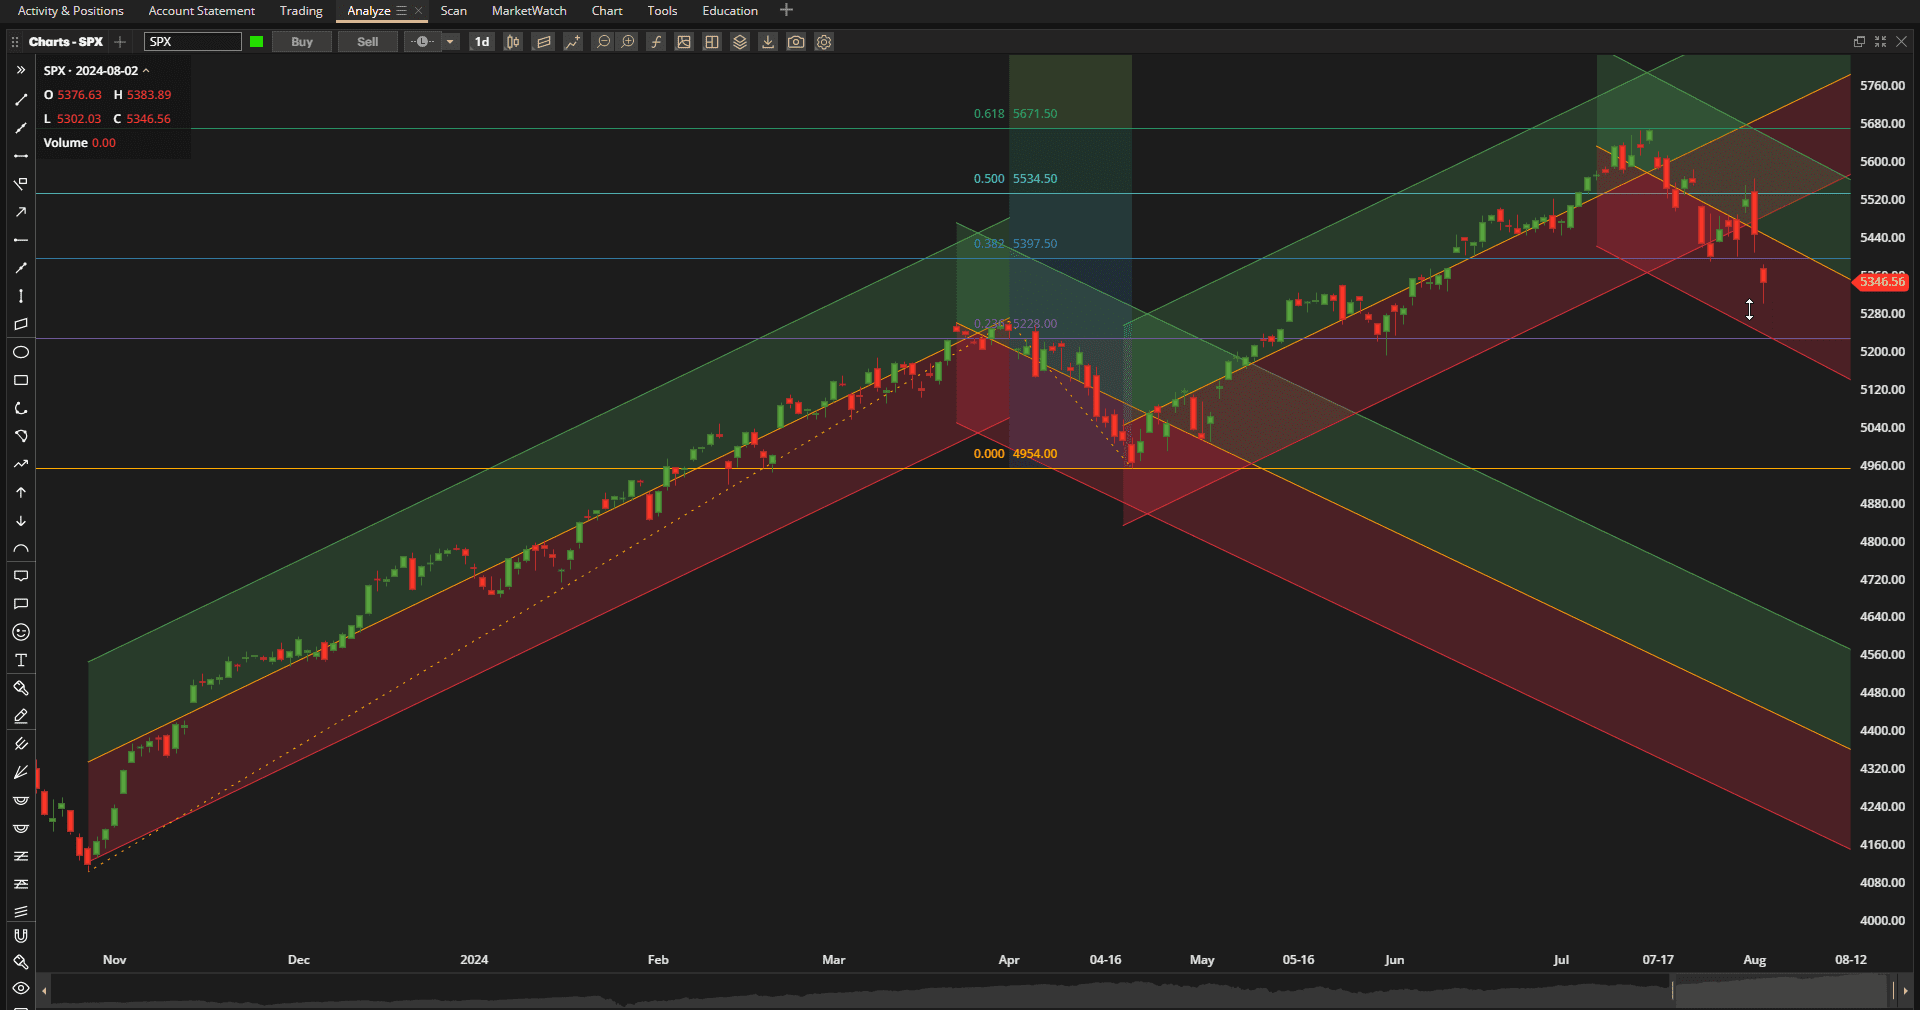 Although it is a little early to declare a correction in the trend (requires a 10% pullback) I have drawn a tentative new bearish channel to guide our eyes as to where we might go if we see a continuation of this pullback. The ~5200 level (an 8% pullback) might provide a strong area of potential support.
Again, as in recent weeks, US Equities came in near the bottom of the relative performance list:
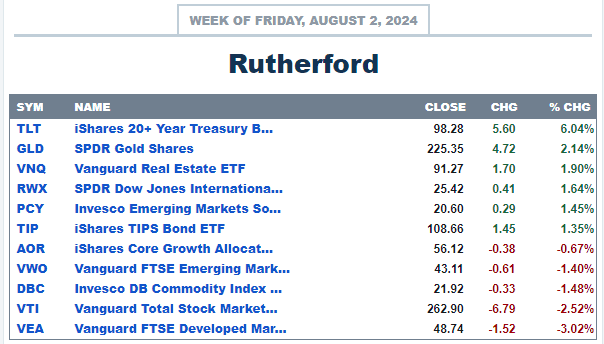
and with holdings in the Rutherford Portfolio looking like this:
 and still weighted in favor of equities, it is not surprising to see poor performance again this week:
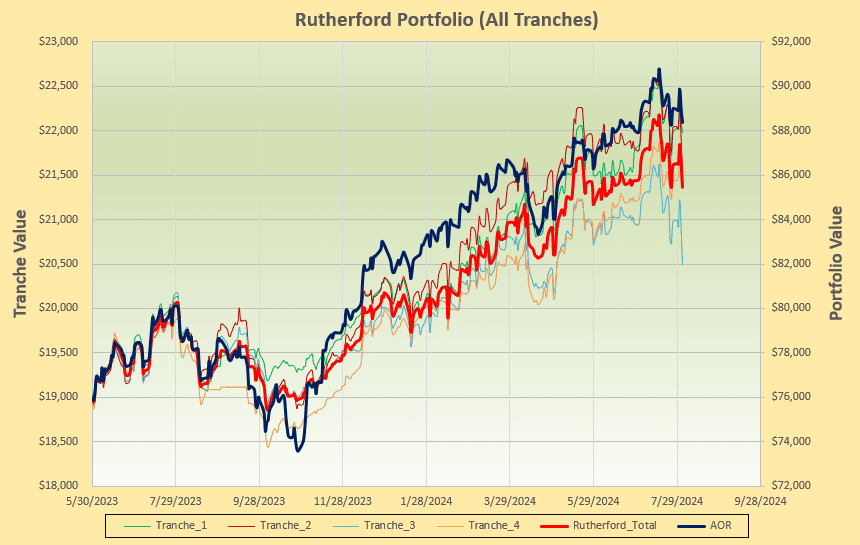 Checking on the rotation graphs:
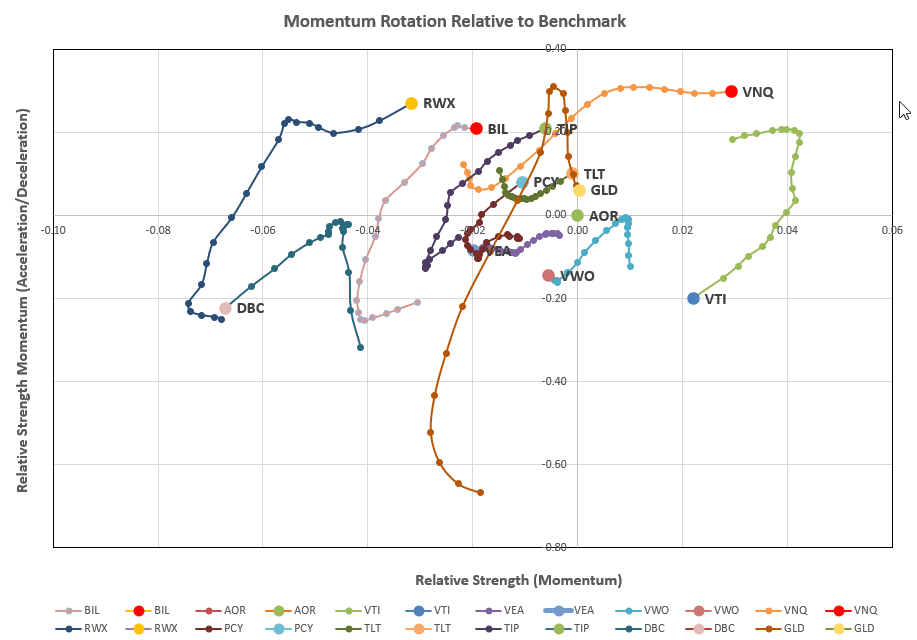 we see the continued rotational weakness in Equities (VTI, VWO and VEA)) and promising strength in Real Estate (VNQ).
Not surprisingly then we see the following recommendations from the rotation model being used to manage this portfolio:
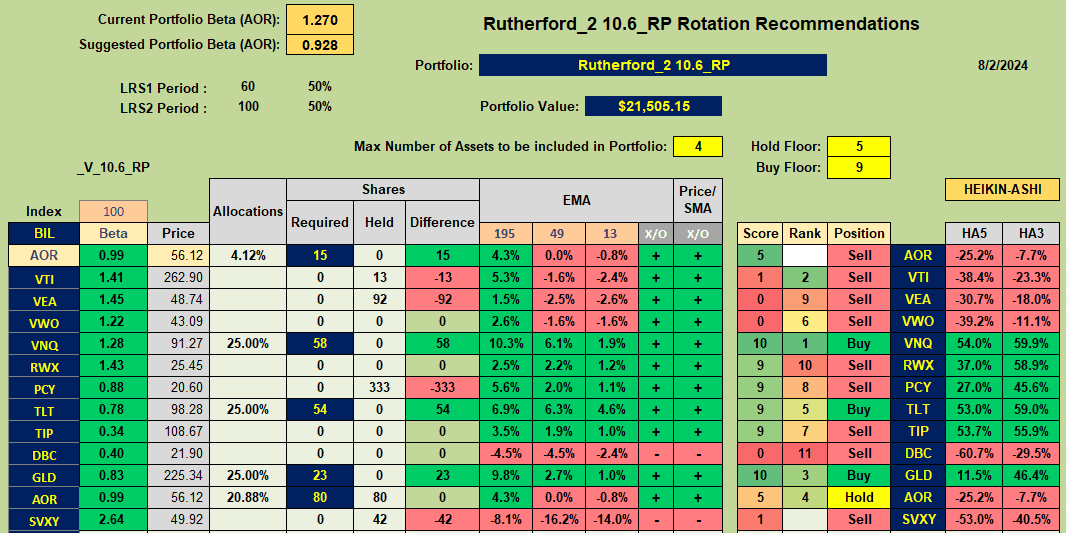 with Buy Recommendations for VNQ, TLT and GLD and a Hold recommendation for AOR (the benchmark fund). Sell recommendations are shown for VTI, VEA and PCY that are currently held in this tranche of the portfolio. Together with my continued reduction in exposure to lower volatility (that spiked significantly this week) this points to a significant adjustment in positions this week:
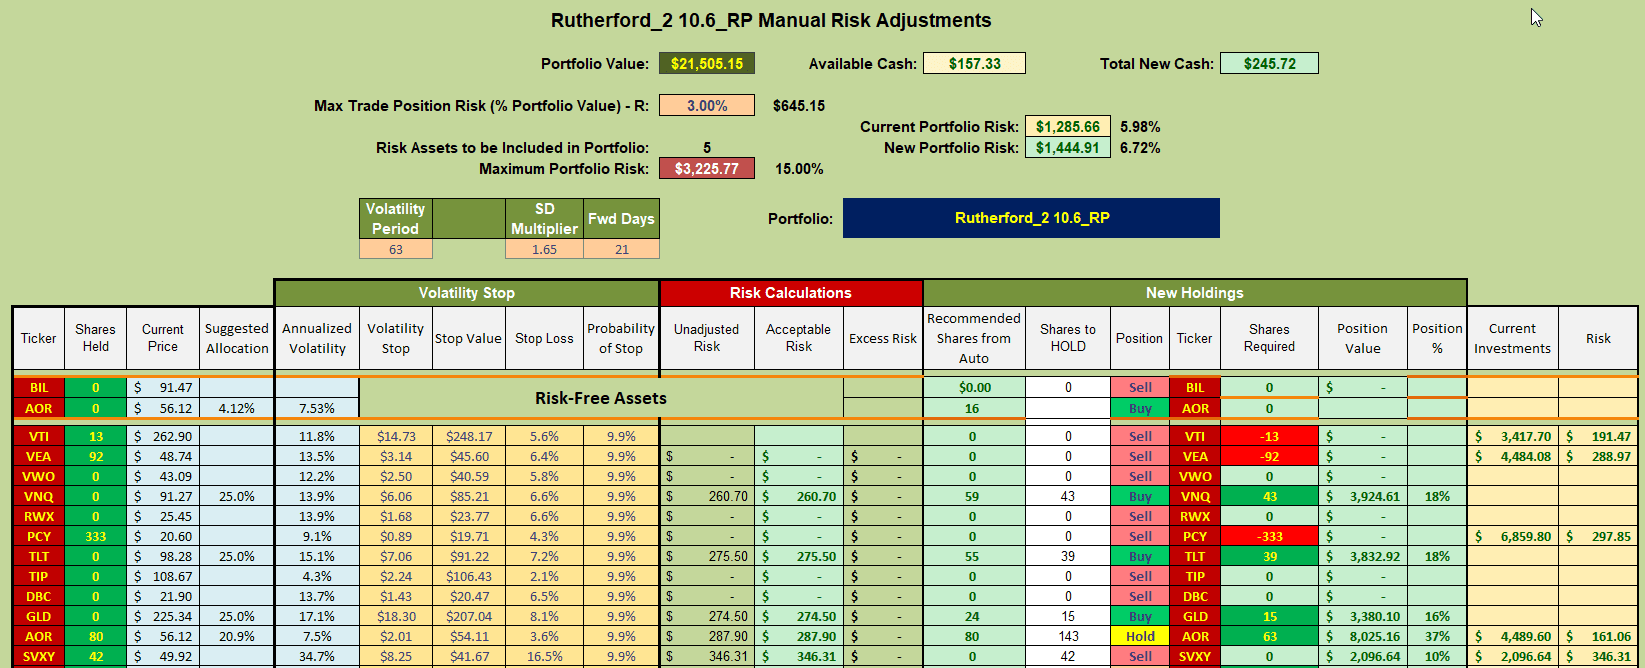 where I shall be selling my existing positions in VTI, VEA, PCY and SVXY and using the cash generated to open/add to positions in VNQ, TLT and GLD with excess cash going to the acquisition of additional shares in AOR.
Discover more from ITA Wealth Management
Subscribe to get the latest posts sent to your email.
Leave a Comment or Question