Six months ago I altered the Pauling portfolio investing model. It now operates using the principles of Asset Allocation. When moving from one investing style to the Asset Allocation it takes time to bring the various asset classes into balance if one does not want to sell securities that are over subscribed. The Pauling is slowly coming into balance as readers will see in the following screenshots.
The goal with the Pauling is to rarely sell shares so it is a tax efficient portfolio. In addition, when asset classes are below target new money and dividends are used to purchase shares in those ETFs that are most out-of-balance on the low side. Asset classes out-of-balance by more than one percentage point on the low side is unacceptable.
Pauling Asset Allocation Portfolio
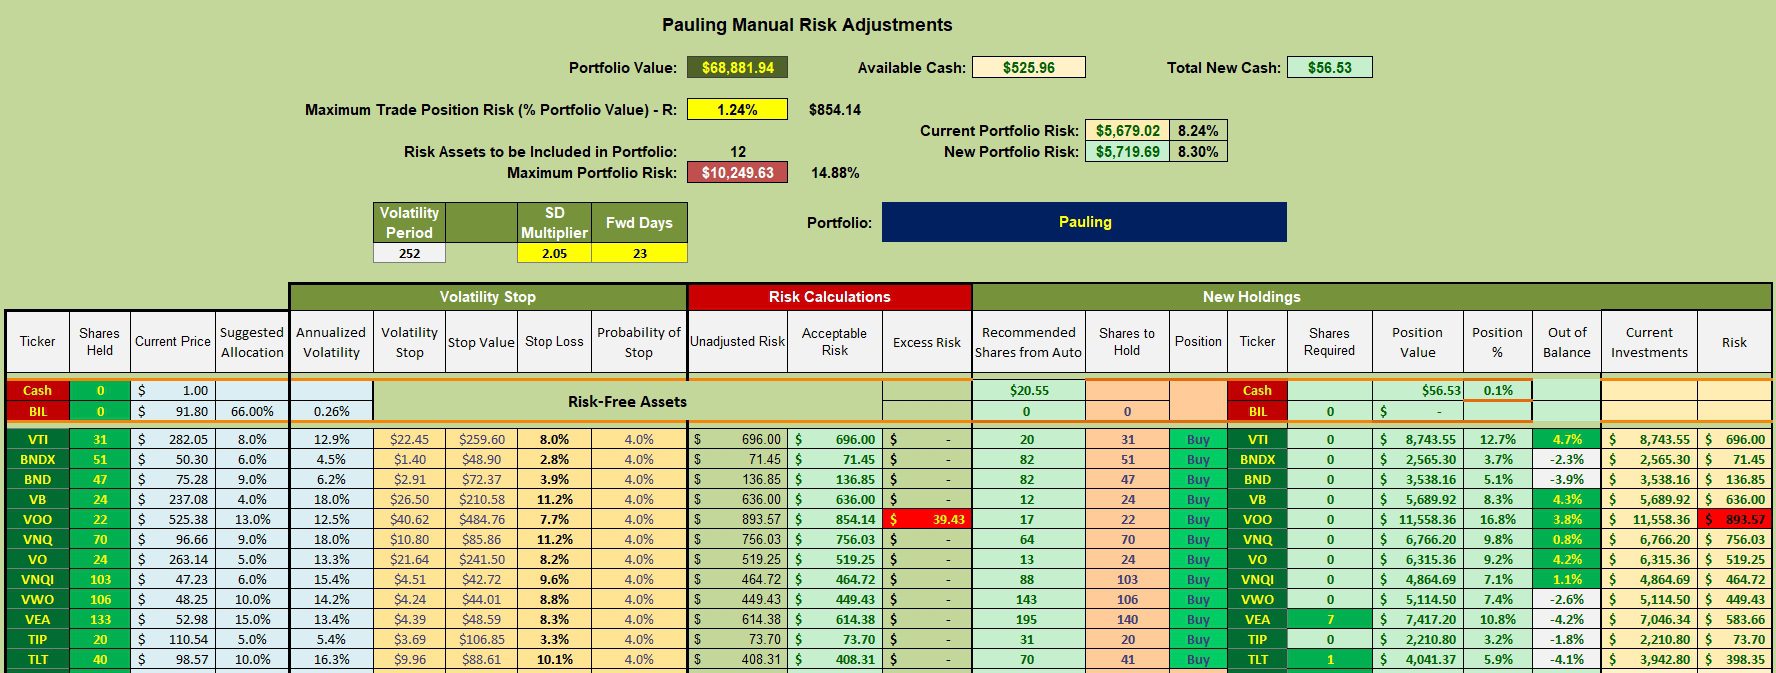
Below is the investment quiver and current holdings for the Pauling. Over on the right-hand column are asset classes out of balance. Developed International Equities (VEA) and U.S. Treasuries (TLT) are most below target so I will focus on those two holdings.

Pauling Manual Risk Adjustments
Limit orders are in place to purchase seven (7) shares of VEA and one (1) share of TLT. The third quarter should bring in a few dollars. That money will be use to bolster ETFs or asset classes most out-of-balance.

Pauling Performance Data
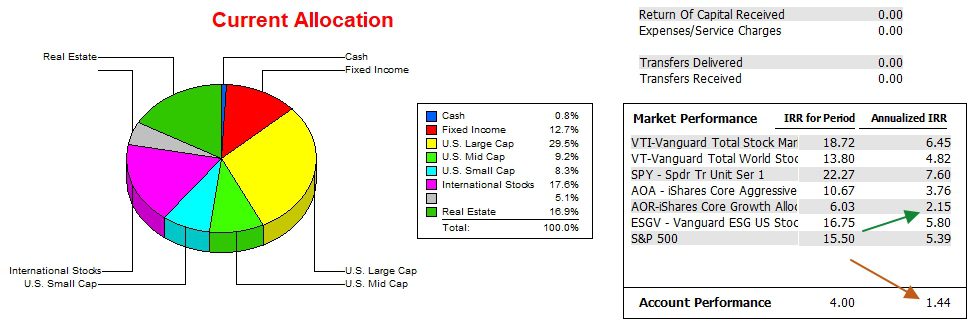
Since 12/31/2021 the Pauling lags the AOR by less than one percentage point. If the Asset Allocation is set up correctly the Pauling should be able to overtake the AOR benchmark by this time next year.

Pauling Risk Ratios
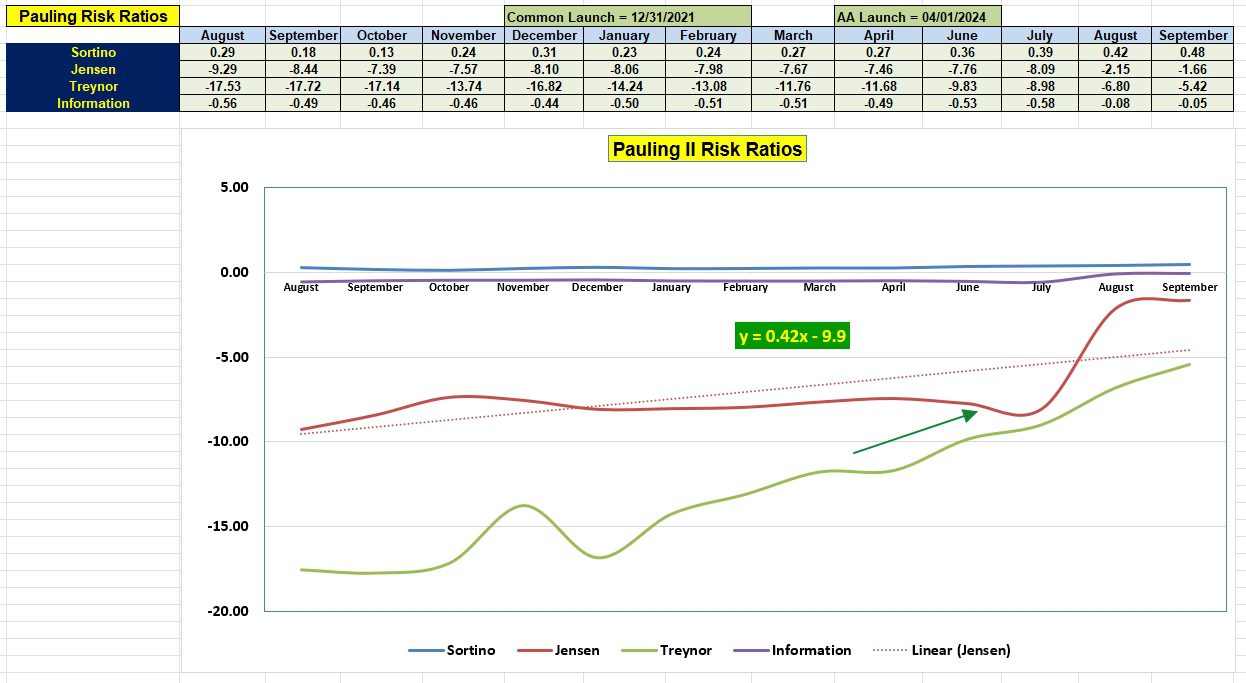
Since setting up the AA model for Pauling the Jensen Performance Index has improved. It is still not positive, but the trend is in the right direction. Improvement in the Information Ratio is another signal the AA model is working. The question remains – is the trend positive do to the construction of the portfolio or is it only correlated with a bull market? When the next downturn comes we will have an answer to this question.

Discover more from ITA Wealth Management
Subscribe to get the latest posts sent to your email.
Leave a Comment or Question