
Natural “Tree Art” in Arches National Park, Utah
In the first two parts of this series on portfolio construction I have focused on simplicity in terms of the number of assets that might be included in the portfolio and the level of management effort required to monitor and maintain the portfolio so as to generate acceptable returns. I have addressed risk at the basic level and shown how risk can be reduced through diversification. In this post I will describe how we might control risk in a more direct/focused way.
Perhaps the most common method of controlling risk is through the concept of “Risk Parity” where we attempt to allocate funds between assets so as to equalize the contribution to total portfolio risk between each asset in the portfolio.
As a simple example, let’s consider a simple equity/bond portfolios with the following characteristics:

Our stocks have a 10% expected return with 18% volatility – where volatility is calculated simply as the annualized standard deviation of daily returns – and our bonds have an expected return of 4% with 3% volatility. If we combine these in a “classic” 60%/40% portfolio we might expect to see a 7.60% return with ~12% volatility. However, volatility can not be measured precisely – only estimated on a probability basis. As Lowell has described in https://itawealth.com/how-risky-is-your-portfolio-may-2021/ we could also use variance (the square of the standard deviation) as our estimation of risk – either way we only have a relative estimate of risk rather than an absolute measure.
In the above portfolio, stocks contribute 10.8% to portfolio risk and bonds contribute 1.2% – a 9:1 ratio of contributions to total risk.
Risk parity is designed so as to balance the risk contributions such that allocations might look like this:

Weights are calculated from the reciprocal/inverse of the asset volatilities (Risk Parity = 1/Volatility) and weights calculate to a ~14%/86% equity/bond allocation. This results in an expected portfolio return of 4.86% with 5.14% volatility. Contributions to risk are equalized at 2.57% per asset class and Sharpe Ratio improves from 0.63 to 0.94.
Thus, we have reduced our portfolio risk and improved our reward/risk performance (risk-adjusted returns), but this comes at a significant cost to total returns – a ~35% reduction from 7.6% to ~4.86%. Compounded over many years this becomes very significant.
Whether we use volatility or variance as our measure of risk is not too important – neither is a true measure of risk, only proportional to it – but, either way, this “Naïve” method of applying risk parity seems to unnecessarily overcompensate and favors higher allocations to low volatility assets than may really be necessary in practice.
More rigorous models for applying risk parity adjustments are available and are often used by institutional portfolio managers – but most of these bring leverage into the calculations to compensate for the high allocations to low volatility assets whilst retaining acceptable (higher) returns. If we wanted to generate a ~10% return in the above example we would have to borrow money and invest twice as much – or double our leverage. As individual investors we almost certainly don’t want to have to consider leverage – it can be beneficial but really complicates things – and isn’t available for retirement accounts.
However, let’s take a look at a different way to achieve a more acceptable level of risk parity. We’ll go back to the data that we saw in Part 1 of this series where we looked at a simple Buy-And Hold portfolio of four “core” ETFs:

And we’ll consider what we might do to control our risk.
If we look at VTI we see that this ETF is showing a “volatility” of 17.54%. If we only wanted to invest in this single ETF but wanted to keep volatility (risk) to, say, 5%, we would simply adjust our allocation in proportion to our desired/actual volatilities. i.e. we would allocate 5/17.54 – or 28.74% of our available funds to VTI and hold the balance in Cash.
Similarly, if we wanted to have the same level of risk from holding VNQ we would allocate 5/20.62 – or 24.25% to VNQ. The same calculation would result in an allocation of 39.75% (5/12.58) to TLT and 30.12% (5/16.6) to GLD.
However, if we add these percentages together, we get a total of 28.74% + 24.25% + 39.75% + 30.12% = 122.86% or, put another way we would have to borrow money and leverage our investment by a factor of 1.23 times. But we don’t want to go the leverage route, so we need to scale back our allocations such that we are only investing 100% of our available funds. We do this by dividing the individual calculated allocations by the total sum of calculated allocations to give us adjusted weightings of 23.39% (28.74/122.86), 19.74% (24.25/122.86), 32.35 (39.75/122.86) and 24.52% (30.12/122.86).
So let’s take a look at how this impacts performance of our 4 ETF “core” portfo5lio:
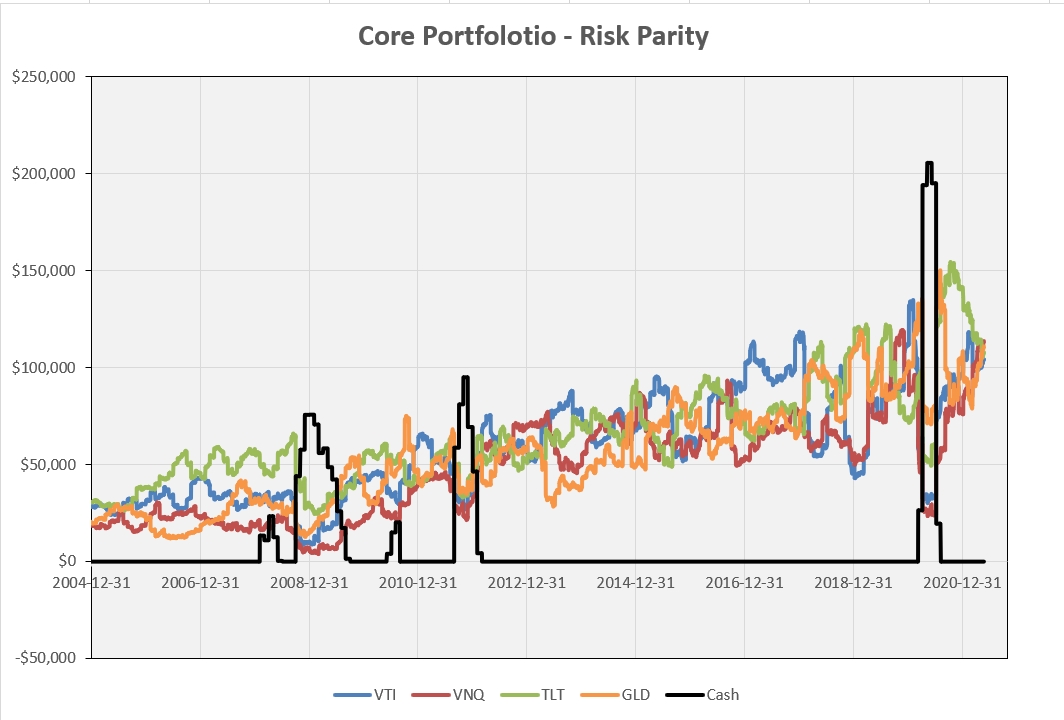
For this test I have calculated the 21-day annualized volatility of each asset and set the target volatility to 5% for each ETF and have rebalanced/adjusted allocations, based on risk parity, on a monthly schedule.
The first thing we notice is that the return contributions from each ETF are roughly equal with a similar level of volatility as expected from our volatility targeting. Another thing we notice is the black line – that corresponds to cash holdings. Depending on volatility, we are not always oversubscribed such that we have to scale back the allocations – sometimes we have excess cash, exactly where we need it – in periods of high volatility (that reduces allocations) corresponding to market declines.
If we look at the impact as a total portfolio:
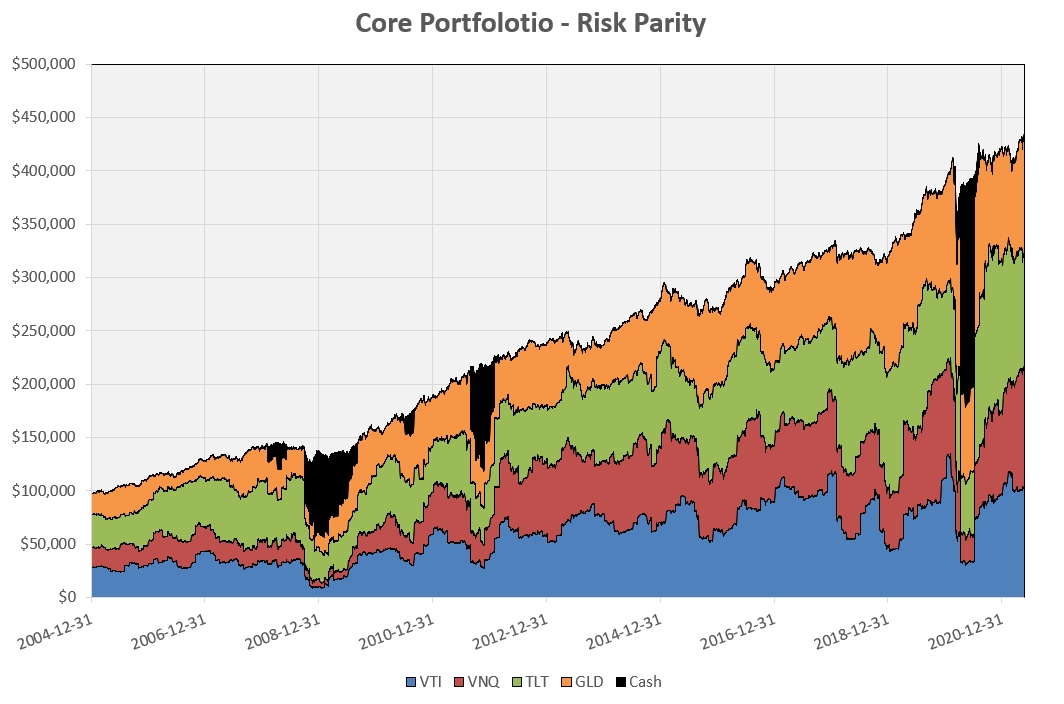
we see that this level of risk management automatically moves us into Cash allocations (black) at times when it is most needed – e.g. through the 2008 financial crisis and the 2020 Covid-19 “panic”.
Some investors may think that a 5% target volatility level is too conservative – so let’s bump this up to 8% for each asset. In this case the individual asset contributions look like this:
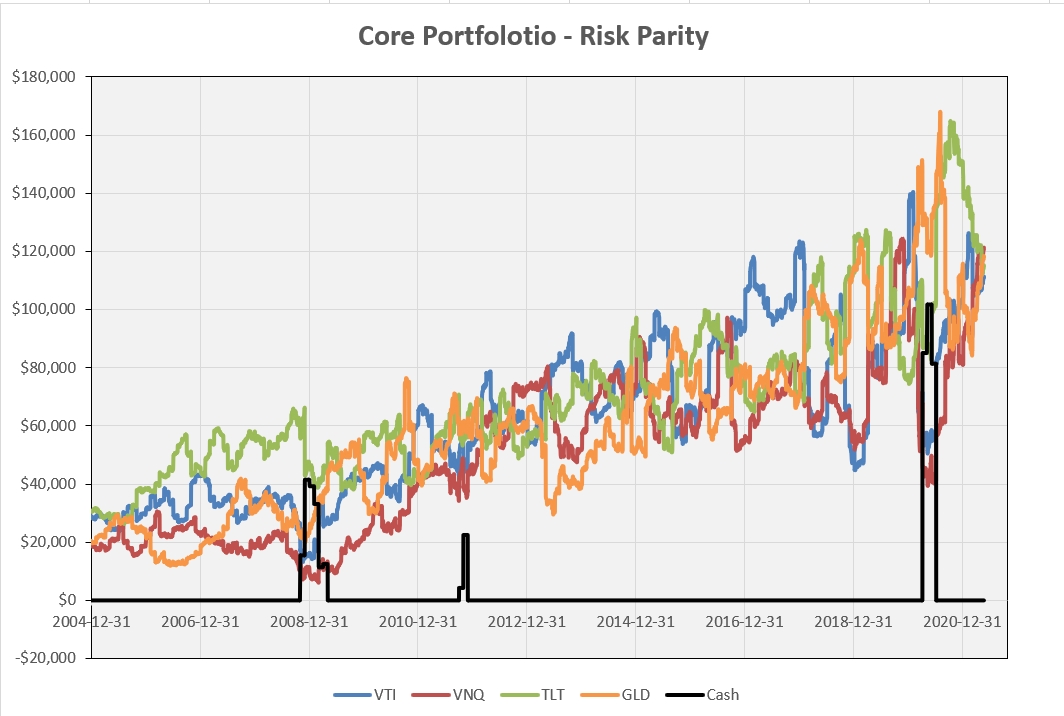
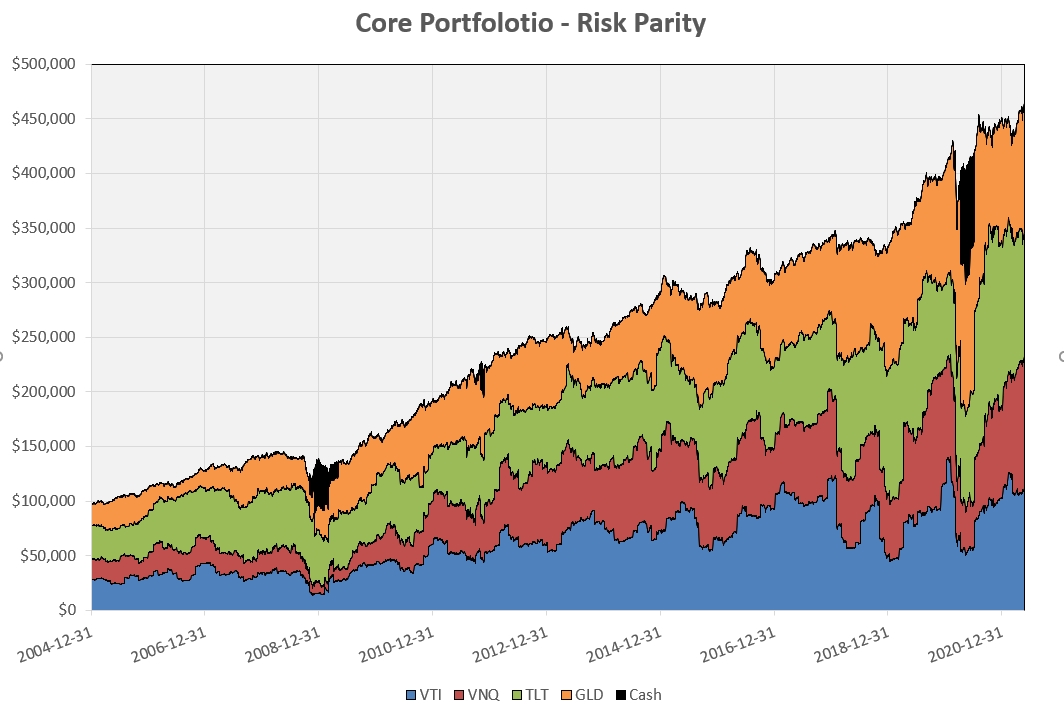
The final portfolio value is a little higher, but this comes at the expense of the higher volatility. Note the smaller allocations to cash (as might be anticipated) and, when stacked, cumulative returns look like this:
Of course, knowing that we can expect to get higher returns from some assets than from others e.g. equities from bonds, we might consider accepting more risk (volatility) in some of the riskier assets providing that portfolio reward and risk are acceptable. The following figure shows what would have happened had we targeted 10% volatility to equities, 9% volatility to gold, 8% volatility to real estate and 6% volatility to bonds:
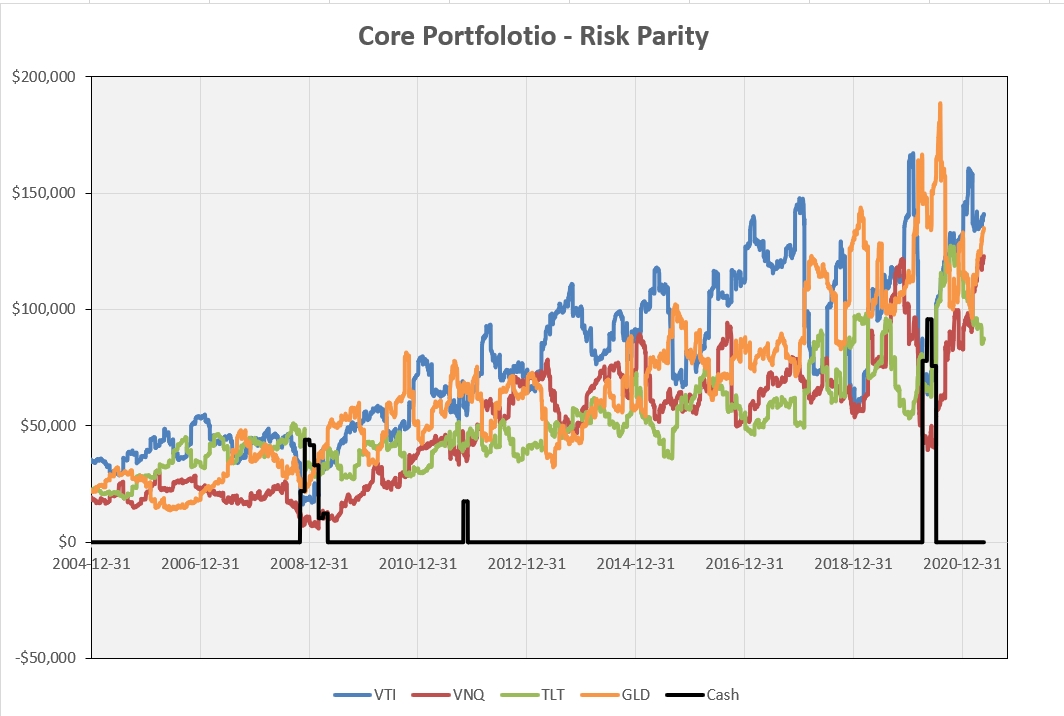
Now we see a little separation in the contributions from the individual assets with a cumulative picture as seen below:
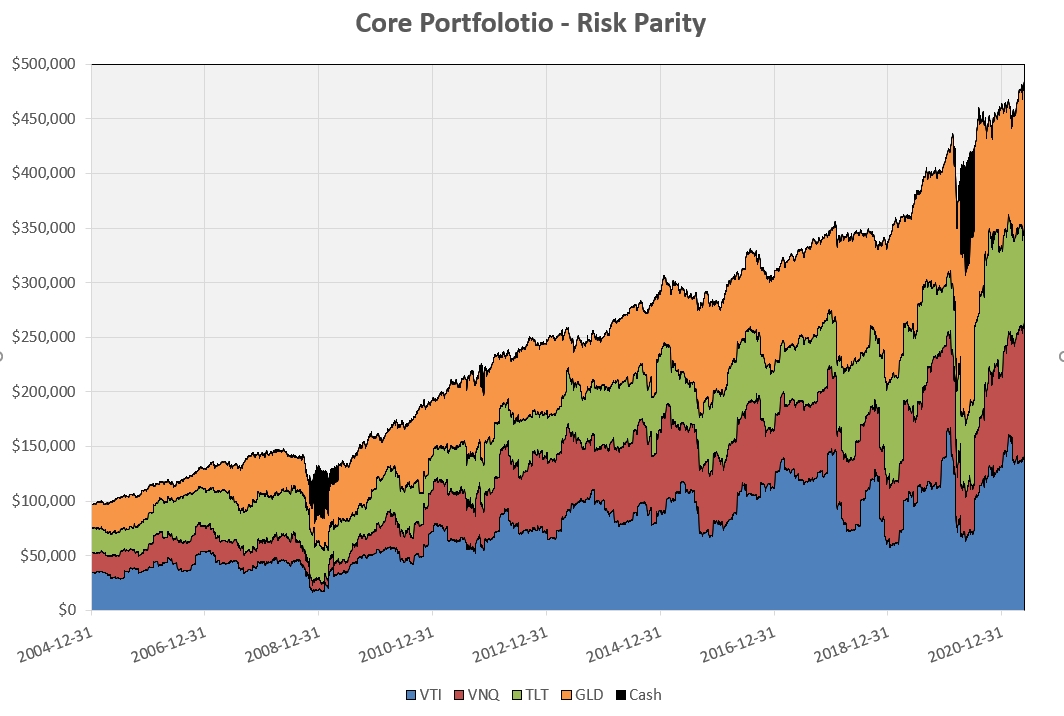
The numbers are difficult to see in the above screenshots, so I have summarized the critical information in the following table:

As we can see, using this application of risk parity with volatility targeting results in:
- An increase in total returns and CAGR;
- A reduction in portfolio volatility (compared with Buy-And-Hold and simple rebalanced portfolios);
- An increase in Sharpe Ratio – we are now at the 1.0 level or higher;
- A significant reduction in Maximum Draw-Down (and corresponding increase in Calmar Ratio).
Summary
To summarize the observations found in the three parts of this analysis:
- There is a distinct advantage in simple periodic balancing of a Buy-And-Hold portfolio – the frequency of rebalancing is not as important as the fact that some level of rebalancing is beneficial.
- Applying a more aggressive risk parity approach to asset allocation (rather than setting fixed Strategic Asset Allocation weightings), when combined with volatility targeting, can significantly improve performance even further. The reduction in draw-down is probably the biggest advantage of using this methodology.
- It is not necessary to hold a large number of assets to achieve diversity and acceptable performance – providing that the assets are chosen carefully with a little thought.
Obviously, these options require a little more time and effort and each investor should make their own decision as to which approach to take. Avoid the temptation to try to optimize the parameters – as we know, past performance is not …. etc. It is the concepts of periodic rebalancing and volatility targeting that are important.
In the near future (when I have finished moving a little money around) I will be opening a new “core” portfolio that I will review regularly on the ITA Wealth Management site. I’ll use the risk parity methodology – probably with an 8% across-the-board volatility target and I will add International equities to the four ETFs used in this analysis. [I ignored international equities in this analysis in the interests of keeping the concepts as simple as possible – also, the ETF that I will probably use, VSS has a shorter history and would not have covered the 2008 financial crisis].
Your thoughts and feedback are welcomed and encouraged. This post probably needs to be read a few times so a PDF copy is available for download at https://www.dropbox.com/s/u126tik3ociu797/Constructing%20a%20Core%20Portolio%20Pt3.pdf?dl=0
David
Discover more from ITA Wealth Management
Subscribe to get the latest posts sent to your email.
This series of articles has been very interesting and I look forward to following the new core portfolio reviews. Thanks for taking the time to lay this out in an easy to understand way.
Thank you for taking the time to write this series of educational articles. I will share them with my children.
Hi David,
Echoing the prior comments, thank you for your good work! I am curious why you are looking at using VSS for international exposure considering that it is small cap and VTI is total market? Does VSS offer less correlation to the other asset classes and to VEU?
Phil
Phil,
Very good question and I haven’t yet made my final decision. The obvious choice to get international exposure would be to go with VEU – and this is probably what the conservative investor should choose for safety. VEU holds assets in both developed and emerging markets and holds mid- and large-cap companies. VSS on the other hand, although holding similar allocation to companies geographically does, as you point out, focus on the small cap sector. Thus, this adds a little “factor” diversity to the portfolio. There is very little difference in correlation between VEU or VSS relative to the broad US markets (VTI) but, my thinking is that this may better represent the state of the economy in those countries than going with a broader market fund. I doubt that the difference would be significantly different – just something to try that sound reasonable. It will probably add more volatility (risk) but, hopefully, over the long term, we would get rewarded for taking this extra risk. The fact that Funds may be strongly correlated does mean that they have the same risk/return characteristics.
David
Curiosity satisfied. Thank you!
Thanks to everyone for your feedback – it did take a little effort to put this together in what I hope was a (relatively) simple manner that most readers, wishing to manage their own accounts, could follow and understand. The objective was to try to explain why we might construct our portfolios in different ways and what the pros and cons might be.. I still consider this to be the solid (“core”) base of a total portfolio that might include more diversified strategies on top of this – but it is where we should start to give us confidence. Diversity comes from both asset selection and strategy deployment.
David
David,
One other question related to when to go to cash. In this model the amount of cash is determined by the desired volatility. Considering the events of March 2020, I wonder if monthly rebalance would have been frequent enough to signal to go to cash or if would have been too late to avoid significant drawdown?
Phil
Phil,
Another good question. Yes, the amount of cash will depend on the desired volatility and I will be selecting this for my portfolio so as to keep me fully invested in normal/stable markets. The more assets in the portfolio, the lower the target can be to avoid excess cash.
However, when markets are not stable, volatility increases and pushes us towards cash – so, it depends on how quickly we can pick this up. Thus, the volatility look-back period becomes a significant parameter. Setting the volatility look-back period to say, 21 days, will detect changes quicker than a 63-day lookback, but it will also result in more/larger adjustments that may overcompensate if the market recovers quickly. And, of course, we still have to remember the impact of timing/review date luck.
As for the March 2020 pullback – this was very fast and only lasted ~1 month with a fast recovery so it would probably be impossible to avoid it without a degree of luck. But then, an investor choosing to adjust only quarterly might say “what event?” – having gone through the decline and recovery without noticing it. On the other hand, the investor who might be checking his/her portfolio every day might have detected the “event” quickly, and made adjustments, but may have been whipsawed on the fast recovery. This is not likely to be as big a problem for the “core investor”, who is trying to keep invested in all his/her assets (plus cash), than it is for the momentum investor who trying to rotate between assets – but the effect will still be there to some degree. We can’t win them all 🙂
David
could not find part one -?
Ken,
Is this what you are looking for?
https://itawealth.com/constructing-a-core-investment-portfolio-part-1-buy-and-hold/
BTW, I am attempting to move to a new membership application and the new app requires special permission. If some blog posts are blocked, let me know and I will try to release them. This is a problem moving forward with a less expensive membership list.
Lowell
Oops! Wrong Membership Level
You do not have the correct privileges to access this content. To gain access to all portfolios, upgrade to a Platinum membership. To register as a Guest, go to the Home tab and look for Register in the right-hand column.
A Platinum membership is highly recommended as it gives you access to all the ITA material. when I tried to click the link for part 1
Ken,
There are a few blog posts reserved for Lifetime members.
Lowell
I get the same “wrong membership” message when I click on several links
T,
As I replied to Ken, there are a few blog posts reserved strictly for Lifetime members.
Lowell