
Springtime in Colorado
In this series of posts I will attempt to explain how a new investor might go about constructing a “core” portfolio that requires minimum maintenance. I will try to explain why we might want to use certain asset types from which to construct this portfolio, how we might choose to allocate available funds to the different assets and the impact of “asset diversification” on portfolio performance.
We first need to ask ourselves a few obvious questions:
- “Why do I want to invest?”.
Presumably the answer to this question is something like “to make a little money and to increase my wealth.”
- “What are my major concerns?”.
There may be a number of answers here but the major ones are likely to be “how much risk will I have to take and how will I be able to mange my risk?”
- “How many assets will I need to buy and how will I decide which ones to buy?”
This is a critical part of portfolio construction and can be as simple or as complex as we want to make it – providing that we understand how the portfolio may perform in terms of expected returns and risk and are comfortable with these expectations. Although Mutual Funds have been around for many years (originally with heavy front- or back-end load fees), the introduction of Exchange Traded Funds (ETF’s) in the 1990’s, has provided individual investors with the ability to buy and sell these instruments directly, with low fees and commissions, so as to make it much easier to construct and manage their own portfolios. Funds are attractive because they offer diversification within a chosen asset class through the purchase of a single Fund and ETFs trade infra-day so can be bought or sold at any time of the day when market exchanges are open.
- ‘How much effort will I need to put into this and how confident can I be that I can do better than a professional advisor?”
This will depend on the model that you choose to use and I will start with the simplest – Buy and Hold – set it and forget it. This may be an acceptable model for anyone that really doesn’t have the time or desire to “manage” their portfolios – and may be most appropriate for younger investors with a long-term time horizon (say 20+ years). Some of the pros and cons of different models should become clearer as we progress through these posts.
You may have a lot of other questions, if so, leave them in the comment box below and I will try to address them. I am hoping that this series of posts will give you the confidence to manage your own portfolio(s).
Let’s look first at a simple four-asset portfolio that we might Buy-And-Hold.
What is the first “asset” that we should buy?
If we look at historical data, we note that equities (stocks) tend, on average, to increase in value over time and that this asset “class” (equities) has generated the highest long-term returns. The key words here are “on average” – some stocks show very strong growth over extended periods of time (e.g. Apple, Amazon, Google … etc) while others (remember Enron, Woolworth, Pan Am, Kodak, Lehman Brothers …) have failed spectacularly and no longer exist.
So, why would we would want to “invest” in stocks? Quite simply, we are buying an interest in a company in the expectation of sharing in future cash flows that might be generated by the company. Clearly, we don’t want to risk the possibility that the company in which we invest may go bankrupt and our “investment” may go to zero. Therefore, we want to reduce this risk by investing in more than one company – or to “diversify” our investment(s). However, even if we could afford to, it wouldn’t be practical for us to buy shares in, say, the top 500 companies listed on the New York Stock Exchange (NYSE). We could choose to invest in fewer companies – but then we would have to decide which ones to choose. Fortunately, since we want to keep things simple, we can buy a single “basket” of stocks through a Mutual Fund, or, more recently, through an Exchange Traded Fund (ETF).
What confidence can we have that this is a good long-term “investment”?
Let’s take a look at the performance of the Vanguard Total Market Index Fund (VTI) – an ETF that invests in large-, mid- and small cap stocks across both “growth” and “value” styles and that tracks the performance of the US Total Market Index.
 This represents a total return of ~400% over ~16 years at a Compounded Annual Growth Rate (CAGR) – assuming dividends are re-invested – of 10.35% with an annualized volatility of 17.54%. Volatility is often used as a measure of risk, and, using the Sharpe Ratio (CAGR/Volatility) as a measure of Reward/Risk this results in a Value of 0.59. This is ok – but we would like to see a ratio closer to 1.0 (or higher would be even better).
As can be seen, although VTI has an attractive 10+% growth rate over the long-term investment horizon, this comes at the expense of large Draw-Downs (DDs) over (relatively) shorter periods within this time frame. In particular, the 2008 financial crisis resulted in a ~55% DD over an ~18-month period. The 2020 Covid-19 crisis resulted in a rapid ~29% DD over about a one-month period. There were 2 or 3 smaller DDs in this ~16 year time frame and, although not particularly worrisome in terms of a long-term perspective, they likely posed concerns for anyone that might be affected by loss of wealth in the shorter term – e.g. senior citizens relying on the money in their retirement – or students depending on funds for education. It took ~2 years to recover from the 2008 financial crisis and for stocks to return to their pre-crisis values.
Warren Buffet suggests that buying (and holding) a Fund that tracks the S&P 500 Index is about the best single asset that an investor can buy.
However, it is preferable to avoid these large DDs – so, how can we compensate for these periods of high risk where we can expect to realize significant losses? A 50% DD requires an investor to double the value of his/her remaining funds (generate a return of 100%) simply to get back to his/her original level of wealth. This takes time – generally longer than the length of time to lose that wealth. The way to reduce the impact of this problem is to look for assets that do well in periods when equities are out of favor.
What is the second “asset” that we should add to the Portfolio?
Historically, this has been achieved by investing in bonds or treasuries. So, let’s take a look at the performance of long-term US Treasuries over this same period through the eyes of another Fund – the 20+ year Treasury ETF (TLT):

If held to maturity bonds (generally) are “safer” than stocks because they have a guaranteed payout at maturity. So, unless the issuer goes bankrupt, we know exactly how much we will receive at the end of our investment. However, we don’t always want to hold bonds to maturity and so there is “interest rate” risk since, if interest rates rise (that will not result in a greater return in the bond that we are holding), we will have to sell the bonds at a discount to make them attractive to buyers. High Yield “Junk” bonds may also carry the same risks as their stock compatriots if the issuer has to go into bankruptcy – however, bond holders are paid out first, in preference to stock holders in the event of such disasters.
I have chosen to look at TLT because it is about as “safe” as we can get and, because it is a long-term bond fund, it pays a higher dividend (coupon) than shorter term bond funds. Risk is diversified through the combination of holdings with different maturity dates – but other bond funds are available with more diversity (including corporate bond issuers) should an investor choose to add this extra degree of diversification.
The CAGR for TLT, as shown in the above figure, is 6.15% with a volatility of 12.58% for a Sharpe Ratio of 0.49 – not quite as good as for VTI. However, as we shall see shortly, there is an advantage of combining these two asset classes.
Add a third asset??
Ok, now I’m looking for an asset that might further help us reduce risk. So, what asset(s) might do well in uncertain times when equities (stocks) and bonds might be out of favor. This latter condition might occur in periods of high inflation and high interest rates where, historically, investors have migrated to Gold as a “safe haven” to preserve wealth. Fortunately, with the introduction of ETFs, we can now establish a position in Gold without holding the physical metal and having to deal with storage and other associated costs.
Let’s take a look at how the GLD ETF has performed over the past ~16 years:
 This does not show the same consistent upward movement as equities (VTI) or bonds (TLT) over this period but it does show strong appreciation in the six-year 2005-2011 time period (through the financial crisis) and showed strength in 2019-2020 (maybe due to election uncertainties/concerns?).
GLD has an 8.91% CAGR over this period (higher than TLT) with a volatility of 16.60% – resulting in a Sharpe reward/risk ratio of 0.54.
We could easily stop here, with just 3 ETFs….but….
Want a little more Diversification?
Let’s add a little more diversification to our portfolio by adding an ETF that invests in Real Estate – specifically a portfolio of Real Estate Investment Trusts (REIT’s). We can do this through the Vanguard VNQ ETF:

VNQ has generated a CAGR of 8.13% with 20.62% volatility (Sharpe Ratio of 0.39) – slightly riskier than our other ETFs – but still with an attractive total return of ~250% over the 16-year period.
Ok – that’s it for our simple 4-asset Buy-and Hold portfolio – with an explanation of why the assets were picked and an illustration of the long-term historical performance of all four assets. [Note that, although this is “only” a 16-year sample, we can go back 40+ years and see the same positive trend in these asset classes.]
I might also consider adding a Fund holding international equities for further diversification but the ETF that I like (VSS) – focusing on small-caps (size factor) in developed and emerging markets (geographical diversification) – has only been available since 2009, so I will leave it out of this analysis.
Putting these four assets together in a single chart we see the following:
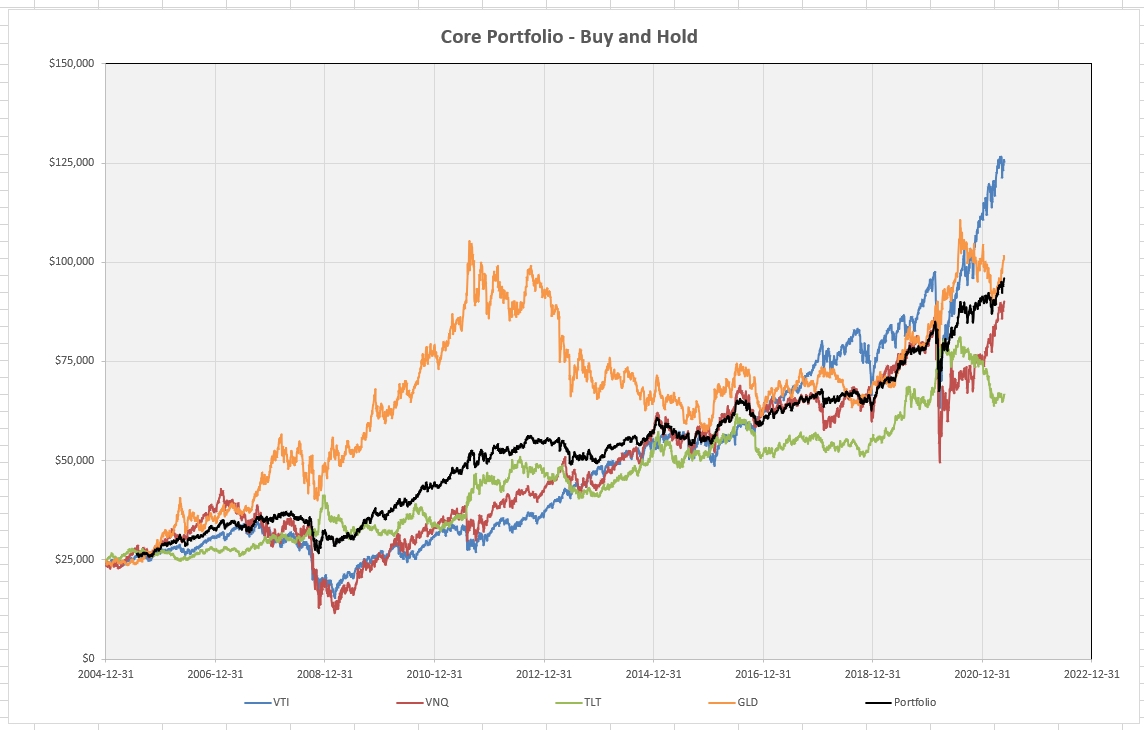
where we note the deviations of the different assets at certain periods of time – when one asset zigs, usually at least one of the other assets zags. The obvious example of this lies in the strong performance of GLD (Gold) around the time of the financial crisis and, again around the time of the Covid-19 pandemic. Gold has long been considered a “safe haven” for money at times of high uncertainty.- but it tends to under-perform in periods of stability, optimism and strong economic growth (e.g. 2012-2015).
So let’s analyze what would have happened had we invested equally (25% of available funds in each of the four assets) on 31 December 2004 and just held those assets, without making any adjustments (other than to re-invest dividends in the same asset that paid the dividend).
The resulting performance is shown below in the stacked area chart:

As we can see, the portfolio would have grown from a value of $100,000 at the end of 2004 to ~$384,000 today – with no action required. This is a Compounded Annual Growth Rate of 8.54% with 10.78% Volatility and a Sharpe (Reward/Risk) Ratio of 0.79.
Although the Draw-Down experienced in 2020 looks the most significant, the 28% Draw-Down from April to November 2008 was the largest DD on a percentage loss basis. Compare this with the 55% DD experienced by VTI alone and you will see one of the benefits of diversification.
The February- March 2020 Draw-Down was a little smaller at 20% and occurred over only one month rather than the seven months for the 2008 decline.
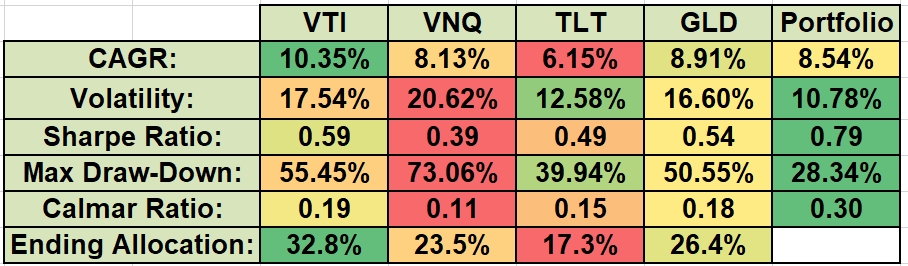
In addition to the Sharpe Ratio, that measures reward relative to volatility, investors also often look at the Calmar Ratio that measures return relative to maximum Draw-Down.
The performance metrics noted above are summarized in the following table:
Benefits
As we can see from the above table, constructing a portfolio of only four diversified ETFs achieves the following:
- Reduces portfolio volatility (risk);
- Minimizes maximum Draw-Down;
- Increases Sharpe Ratio (reward/volatility risk);
- Increases Calmar Ratio (reward/DD risk)
An investor looking to construct a portfolio with minimum management and with a long-term investment horizon will not go wrong by putting together a simple portfolio as described in this post. The only action required would be to re-invest dividends as they are distributed.
Alternative Options
For simplicity I have assumed an equal allocation of funds to the four assets chosen. However, the same general benefits apply if we use different allocations to each asset class. This approach is referred to as Strategic Asset Allocation (SAA) and has been used by a number of prominent investors such as:
- Ray Dalio (All-Weather Portfolio)
- 30% US Stocks
- 55% Bonds
- 15% Commodities and Gold
- David Swensen
- 30% US Stocks
- 15% International Developed Market Stocks
- 5% Emerging Market Stocks
- 30% Bonds (including 15% TIPS – inflation-protected bonds)
- 20% REITs
- Meb Faber and Paul Richardson (Ivy Portfolio)
- 20% US Equities
- 20% International Equities
- 20% Bonds
- 20% Commodities
- 20% REITs
As can be seen, with the addition of International equities (stocks), my example looks something like the Faber/Richardson Ivy Portfolio.
I have not gone through an analysis of the impact of changing relative allocations between different asset classes in this post since there are numerous possible combinations and the overall benefits noted above remain applicable to all combinations. Numbers will change slightly but general trends will remain the same. It is not desirable to delude ourselves that we can optimize on past performance to predict future performance – rather to establish realistic expectations and build the confidence to manage our own accounts so as to generate acceptable performance in terms of reward and risk..
Concerns and Limitations of this simple approach
Although the portfolio described above would have performed very well over the 16 years covered in this analysis we must remember that this has been an exceptional period of bullish growth. Because a wide selection of ETFs have not been in existence long enough to cover the post 2000 tech-bubble crash, this major market draw-down is not included – so keep this in mind.
When we look at our holdings at the end of the 16-year hold period we note that our “equal weightings” are no longer equal. The bottom line of the table above shows that 32.8% of our portfolio in now invested in US equities (VTI) i.e. our allocation is 30% higher than our initial level of funding. This is obviously a consequence of the fact that US stocks, as an asset class, have outperformed other asset classes over this time period – but it does not guarantee that they will continue to do so going forward into the future.
In the next post I will go through an analysis of the impact of rebalancing the portfolio on a periodic basis. This adds a level of additional management (and effort) that investors may wish to consider as they build their portfolio(s).
In my third post in this series, I will be looking at how we can further control our risk levels and this will also affect asset allocation levels – the main reason that I have not gone through an analysis of different SAA models in this post. Of course, again, this will add yet another level of effort in order for us to manage our portfolio(s).
Should you choose to keep a copy of this post for future reference a pdf copy of the post can be downloaded at https://www.dropbox.com/s/bit071vfy57krmg/Constructing%20a%20Core%20Portolio%20Pt1.pdf?dl=0
David
Discover more from ITA Wealth Management
Subscribe to get the latest posts sent to your email.
You must be logged in to post a comment.