
Kipling on guard duty – Image made several years ago.
Kepler is one of two Relative Strength portfolio tracked here at ITA. The other is the Einstein. Kepler currently holds considerable cash and with the imminent debt default close at hand I want to reduce portfolio risk. In this analysis I’ll walk through my thinking as ways to show how readers might do the same if they are managing a Relative Strength or Relative Momentum portfolio.
Kepler Investment Quiver
Below is the current investment quiver and holdings for the Kepler portfolio. The Investment Quiver is built around the principles of asset allocation and market factors from the Fama-French Five-Factor Model. Note the high cash held in the Kepler.

Kepler Security Recommendations
In this worksheet I set four critical factors.
- The VTI target filter (purple arrow) is turned on or set to Yes. We are looking for securities that are outperforming VTI.
- The look-back period is set to one year or 252 trading days. The plan is to reduce portfolio churning.
- The Maximum Number of Assets is set to five. In general, we end up with more than five securities and that is the case this month as you see some Hold? recommendations. Hold? recommends the money manager make a decision to Hold or Sell.
- I am using the Buy-Hold-Sell (BHS) model, identified by the dark blue arrow.

Kepler Manual Risk Adjustments
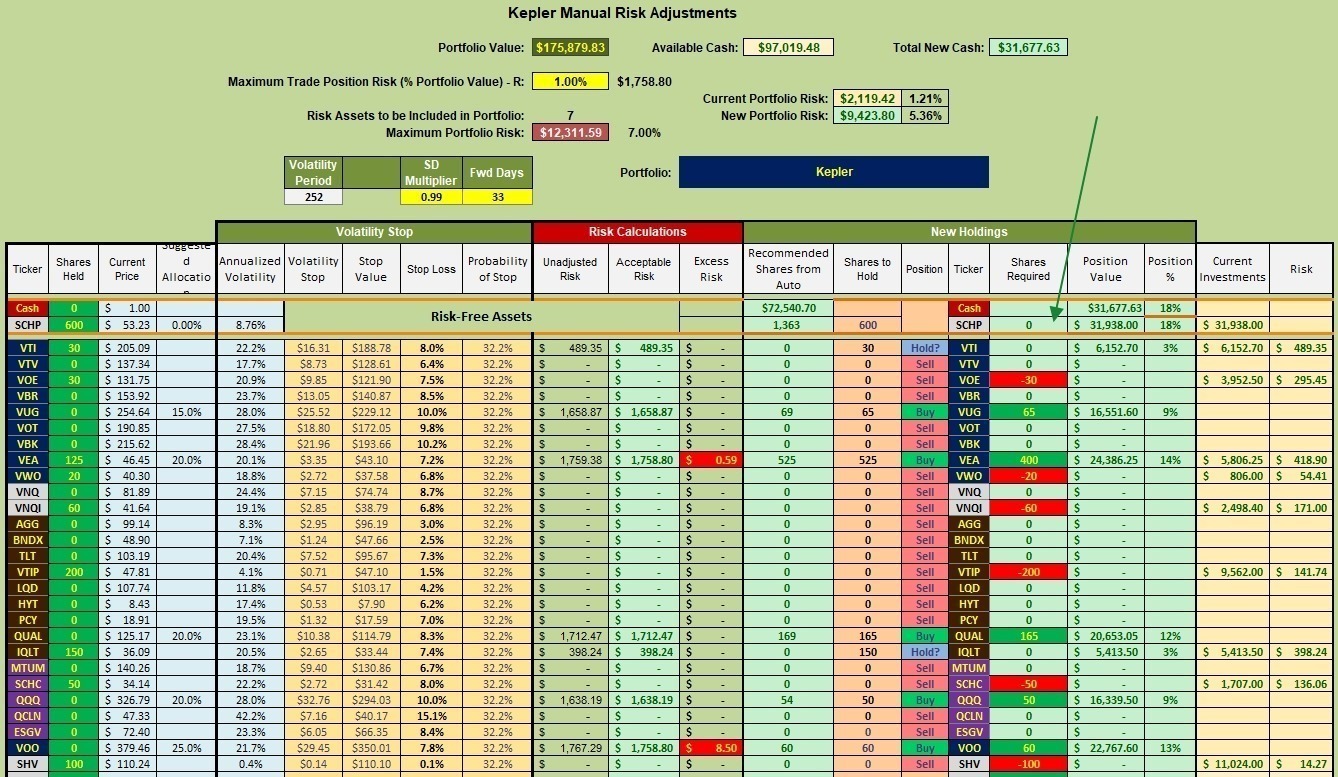
Here are a few critical settings.
- The SD Multiplier (0.99) is set so VTI has an 8.0% Stop Loss percentage.
- The Maximum Trade Position Risk is set to 1.0% resulting in a 7.0% Maximum Portfolio Risk. This is on the high side in this environment.
- Tight TSLOs are set to Sell VOE, VWO, VNQI, VIP, VTIP and SCHC. I changed my mind on SHV as I will use it to hold excess cash. Dividends are higher for SHV than what I can achieve from the money market. By a tight TSLO I mean these are set between 2.0% and 4.0%.
- Multiple limit orders are in place to pick up shares of VUG, VEA, QUAL, QQQ and VOO. Look up these tickers using Yahoo so you can see the asset classes and/or factors involved. Some of the limit orders are set as far below the current price as 20%. Most are set at 5% to 10% below the current price.
Kepler Performance Data
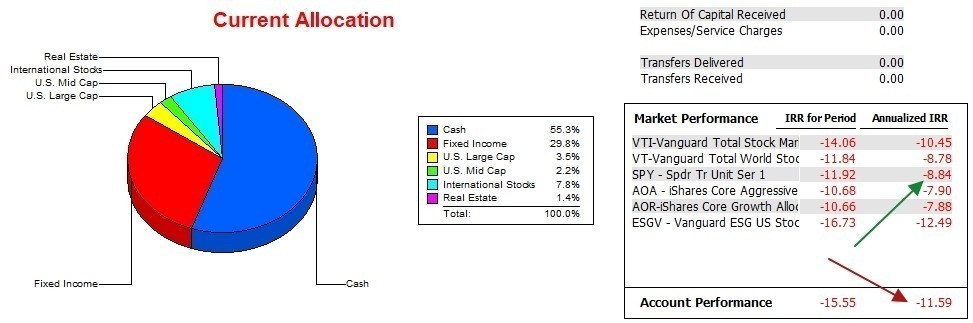
After 16.5 months the Kepler continues to lag the S&P 500 (SPY) by a significant margin. The only benchmark it is besting is the ESGV ETF.
Kepler Risk Ratios
In April the Kepler made money, but since then has slipped in value as we see from the Sortino, Jensen, and Information Ratios.
One way for the Kepler to get back on track is to see a major bear market. This could happen over the next two months and the Kepler is positioned to take advantage of a severe bear market.

The Elements of Investing: Part II
The Elements of Investing: Part III
Discover more from ITA Wealth Management
Subscribe to get the latest posts sent to your email.
You must be logged in to post a comment.