
Botanic Gardens, Singapore
Two really bullish days at the end of the week resulted in a ~2% gain in US Equities as measured by the S&P 500 Index:
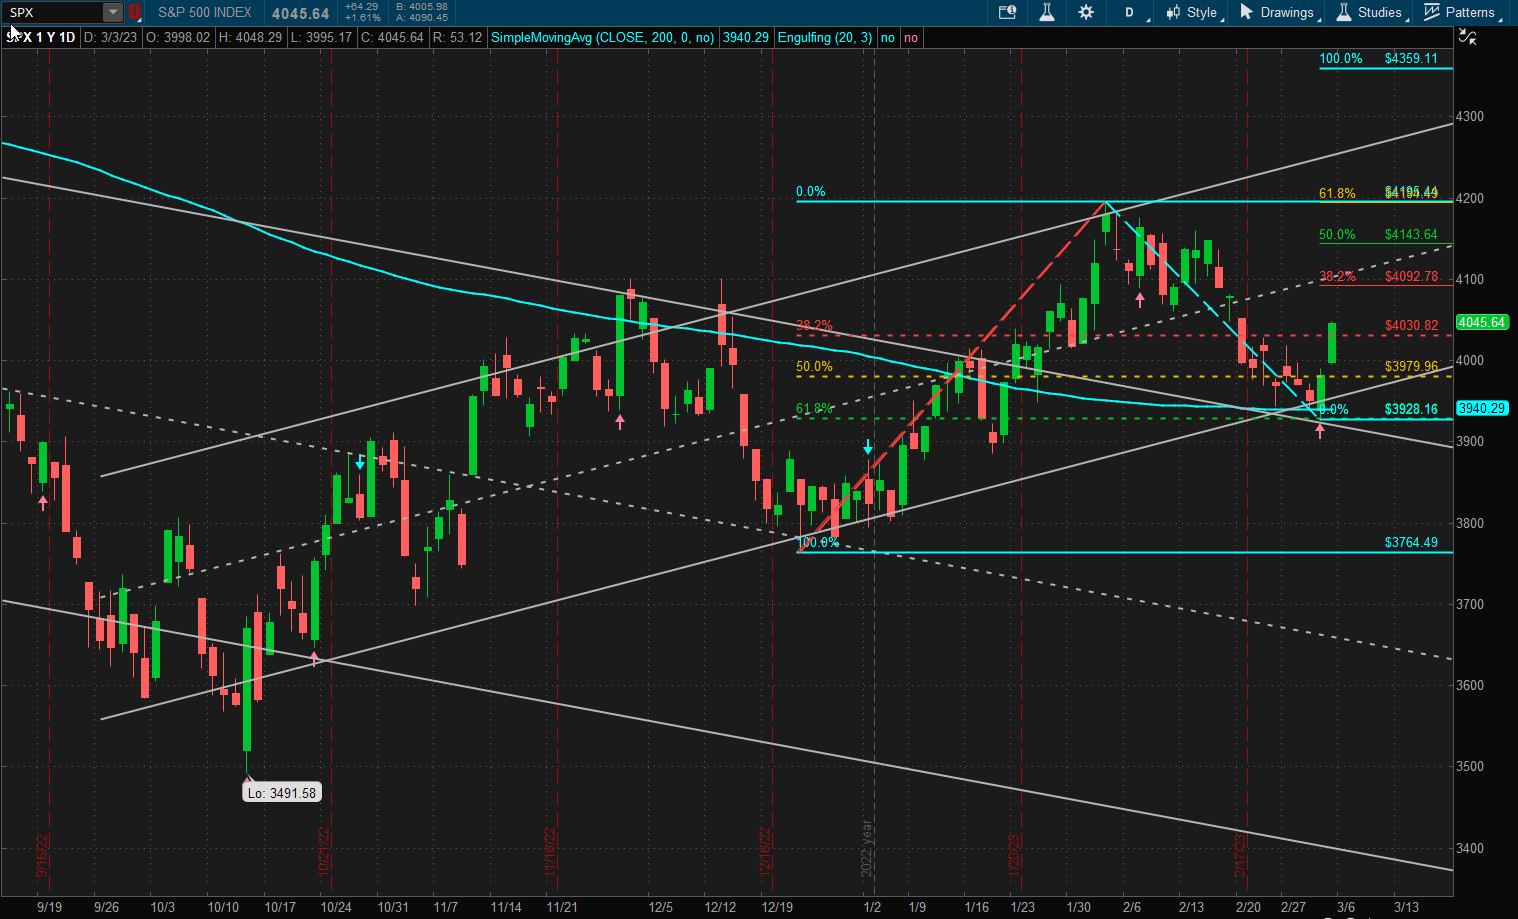 Although support at 3940 was tested at the beginning of the week there wasn’t enough bearish sentiment to push prices below this level and now, maybe, we are heading back towards the top of the bullish channel with a test of the previous high (at ~4200) along the way. There was a lot of technical support at the 3940 level with this being a 61.8% retracement of the prior bullish move and also sitting on the 200 SMA (curved aqua line).
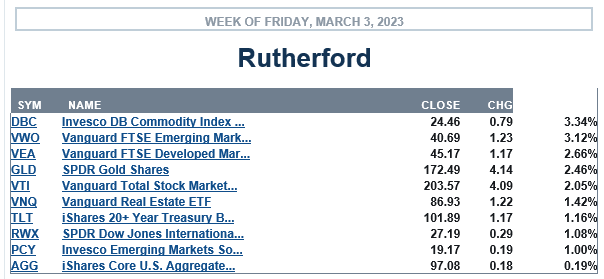
Compared with other asset classes US Equities fell in the middle of the pack with all asset classes showing gains on the week.
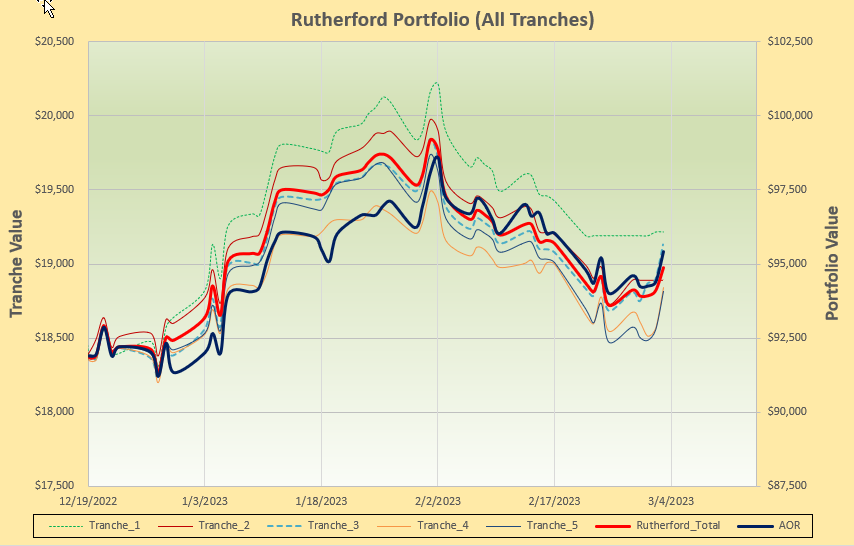
 The Rutherford Portfolio is holding 100% Cash in two of the five tranches:
 and so it is not surprising to see a little underperformance on the week, although this is not too significant:
 Checking the rotation graphs:
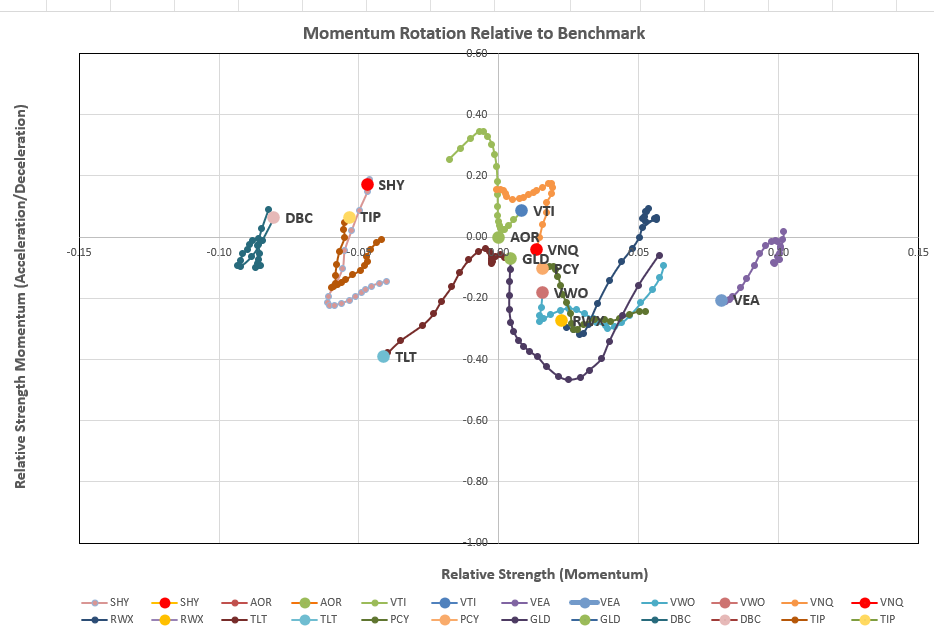 there is not a lot of action in the desirable top right quadrant although VTI is trying hard – so we’ll check the recommendations from the model:
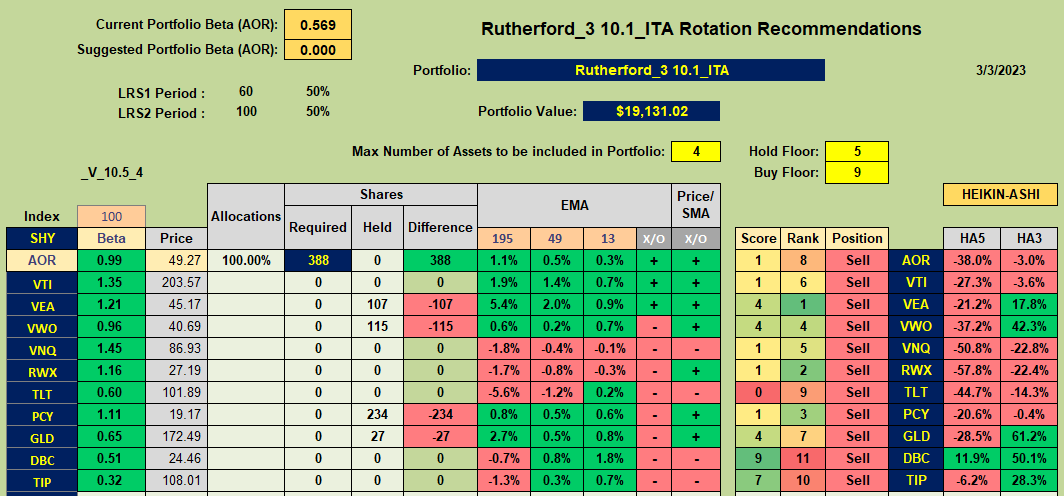 Only DBC has a high score (9) but fails to generate a Buy recommendation since the 13 EMA is still sitting below the 49 EMA. VTI only has a score of 1 since the short term HA signals are still negative.
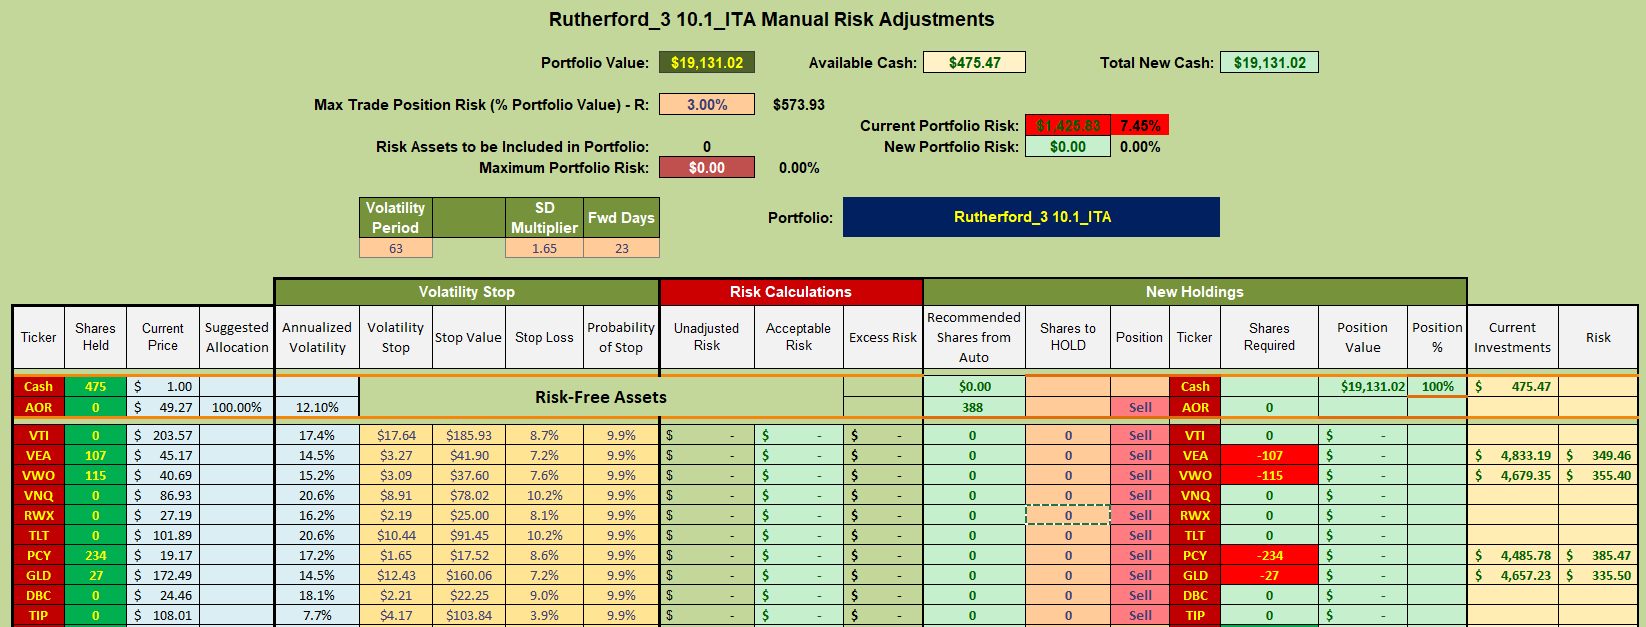
Although I am tempted to hold existing positions in tranche 3 I will show a little discipline and follow the model recommendations (otherwise it becomes meaningless to evaluate the model/algorithm being used). Consequently I shall be selling shares as shown below:
David
Discover more from ITA Wealth Management
Subscribe to get the latest posts sent to your email.
You must be logged in to post a comment.