
Hybrid Orchid, Botanic Gardens, Singapore
The first Quater of 2023 ended with US equities putting in a strong performance closing up over 3.6% from last week’s close.
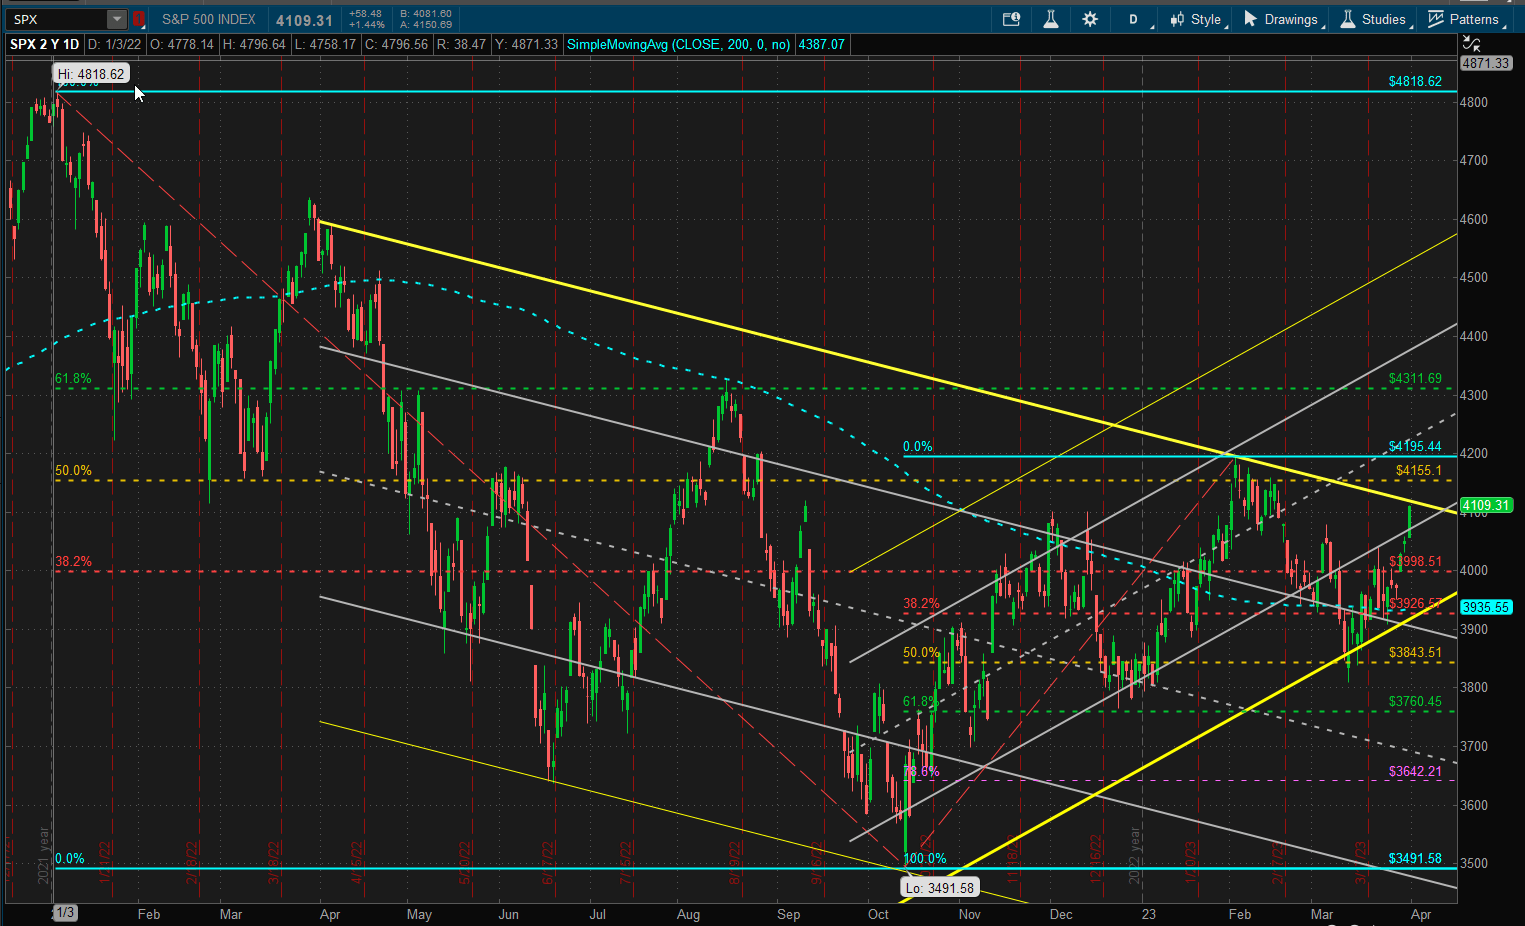 Price is getting squeezed in that pendant zone between the 2 heavy yellow boundaries of the bearish and bullish trend channels. We can expect to see a breakout in one direction or the other sometime in the next couple of weeks with a number of potentially strong support/resistance areas around 4000 in the 3850 to 4150 range. We probably need to break out of that range before we might be comfortable as to whether we are in a bullish or bearish trend.
Although the performance of US equities was impressive, performance of this asset class was outshadowed by performance in US Real Estate and International (Developed Market) equities:
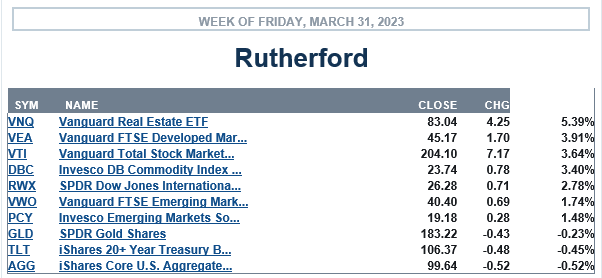 Bonds and Gold were the underperformers this week – that was not good news for the Rutherford Portfolio:
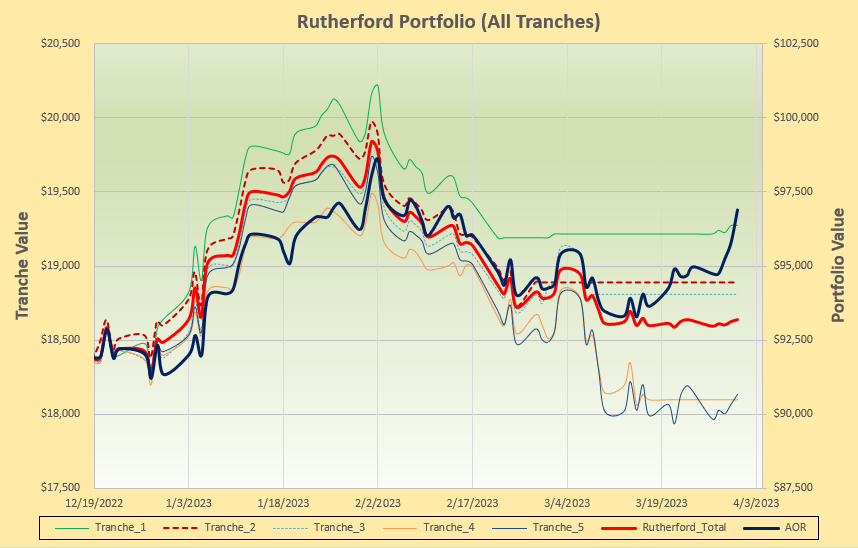 This week we lost significand ground to the benchmark AOR Fund due to high allocations to Cash and defensive assets:
 This week we focus on Tranche 2 where we have 100% Cash to allocate to recommended assets. So, let’s take a look at this weeks rotation graphs (since this is the model that I am presently using to manage this portfolio):
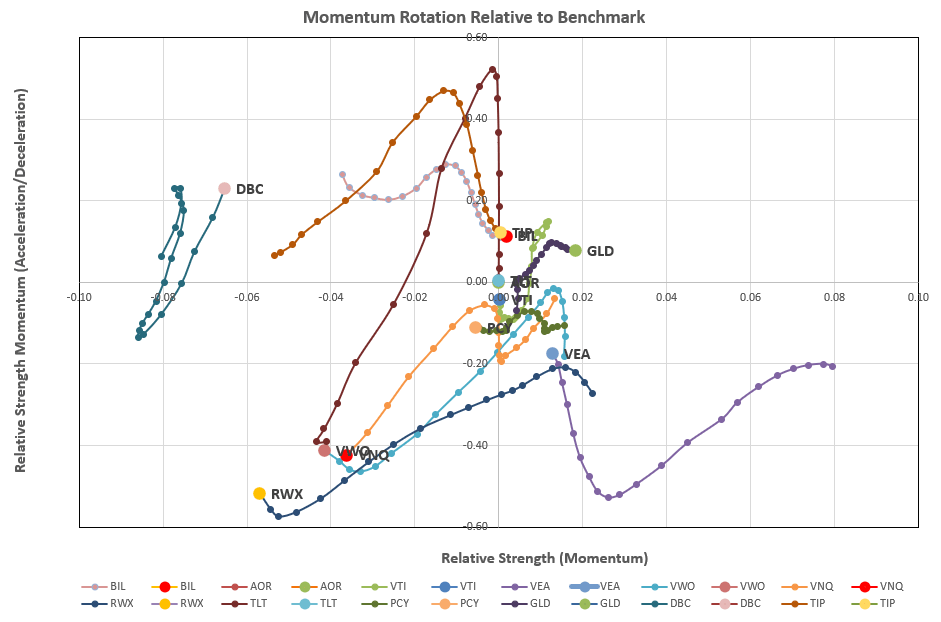 Maybe a little surprisingly the preferred top right quadrant is still populated by defensive assets rather than growth funds. Recommendations from the model look like this:
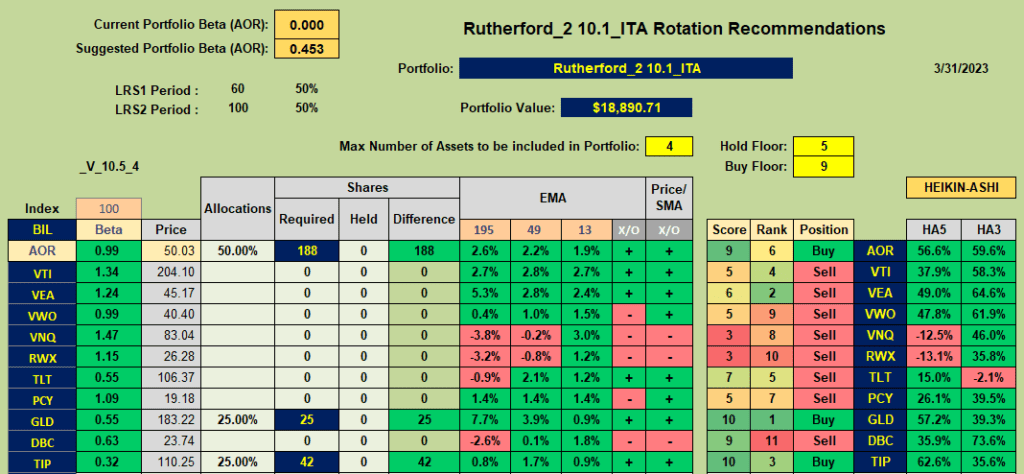 with GLD, TIP and AOR (benchmark fund) being the recommended Buy assets. In order to legitimately test this model I need to stick with the recommendations so my actions next week will look something like this:
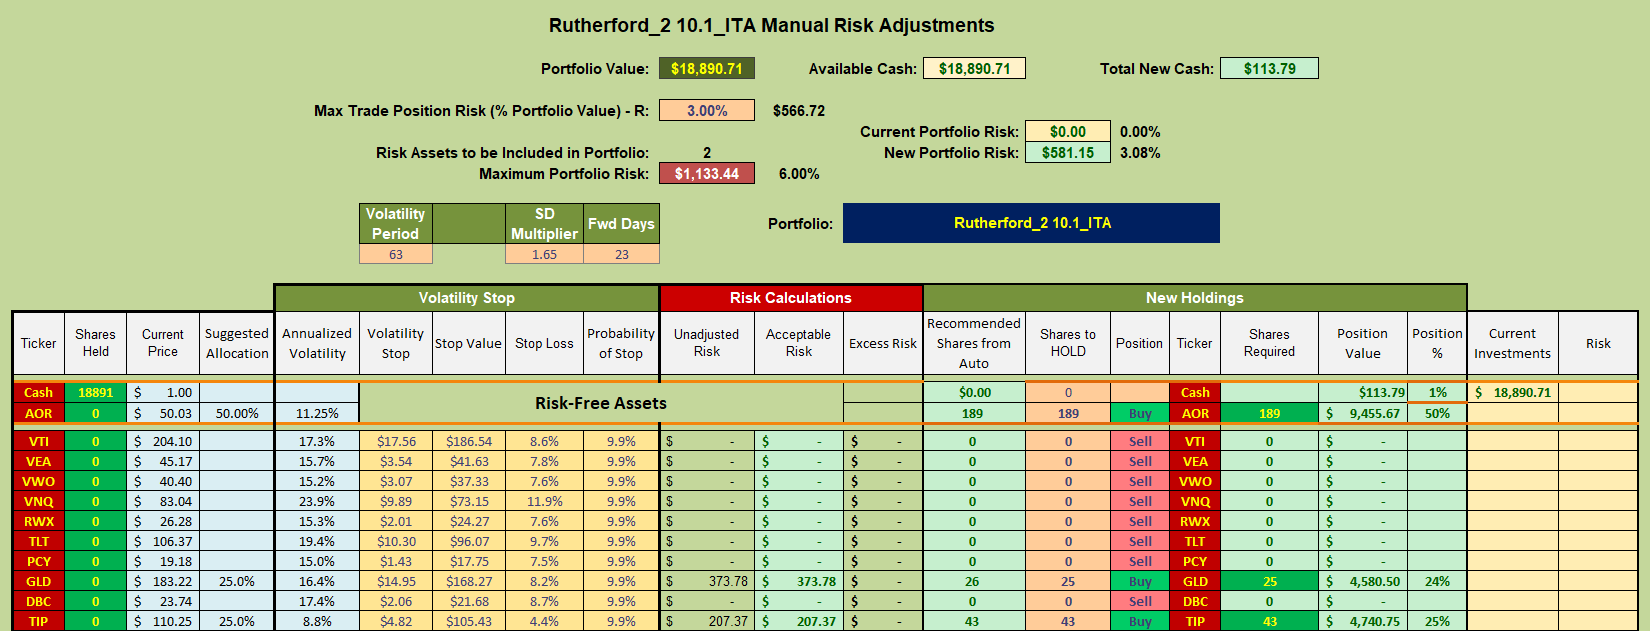 with 50% allocated to the benchmark fund and additions to holdings in GLD and TIP.
Obviously I am a little disappointed with recent (last 2 week’s) performance of this portfolio – although if the equity markets should turn down from here I may still be grateful – and prior performance was relatively good.
As regular readers may be aware the Kipling Workbook that is available to ITA Wealth members offers 4 relative momentum models/systems for consideration – so I thought it might be appropriate at this point to see what the recommendations are from the other models – especially when the rotation model – not included in the Kipling workbook – seems slow to pick up the rotation to a bullish trend in equities.
First, the simple Dual Momentum (DM) model – that follows Gary Antonacci’s suggestion to invest in the best performing asset(s) based on mementum – providing the absolute momentum is positive:
 As we can see from the above screenshot, this model is currently recommending an ivestment in GLD since this is the only asset with positive momentum (relative to BIL – short-term T-notes). So this model, that only looks at longer term momentum look-back periods – although not as long as Antonacci’s suggested 12-month look-back – is not picking up the recent bullish moves in the equity markets.
Let’s go to the other extreme and focus more on the short-term Heikin_Ashi signals (HA model):
 This model is recommending the purchase of VEA, VWO, AOR and GLD – so, as might be expected,is picking up the recent performance in the equity markets. But this system might be too “fast” and may call for more adjustments/trading and be susceptible to “whipsaw” trades.
As a possible compromise I therefore developed the Buy-Hold-Sell (BHS) system that attempts to combine and weight the longer-term and shorter-term signals to generate recommendations/suggestions. Current recommendations from this model look like this:
 i.e we have the same Buy recommendations that we saw in the HA model with optional/discretionary Hold? suggestions for TLT and TIP. Thus, this would suggest that holdings in TLT, TIP, GLD and AOR may not be inappropriate, but, maybe, consideration might be given to VEA and VWO. Note that VTI (US Equities) is still not in this list – although it would be if the Max Number of Assets to be held was increased to 5 or 6).
Finally, a different model (Linear Regression Projection-Convolution – LRPC) that focusses on longer term momentum and is only available on this site. Although a slower reacting system that requires fewer adjustments and may not be as sensitive to recent changes in market behavior, I have stated in the past that, for an investor not wishing to check their portfolio(s) more frequently, this model may be difficult to beat over the long term:
 This model is currently recommending the holding of positions in VEA, TIP, GLD and AOR. Unfortunatly I am not presently managing any portfolios that are using this model and I believe that Lowell has moved his LRPC managed portfolio to the BPI model – so we don’t have any records of recent performance – but I suspect that it might look pretty good compared with other systems.
Everyone always asks “which is the best system to use?” – and there is no right or wrong answer to this question – all systems will probably perform “best” over certain (different) market conditions and so, since we don’t/can’t know what those conditions will be going forward we need to pick one (or, preferably more) system and stick with it. When we change our management system/model because a different system has behaved better over the past n-months this is probably the worst time to change.
As a final note I will re-iterate the point that I have made many times over the past few years – timing (review-date) luck is probably the most significant factor in determining portfolio performance. For an investor only wishing to review their portfolios every month it probably isn’t appropriate to adopt a fast-reacting system that might change it’s recommendations to-morrow. Beyond this, I don’t think any one particular system is better than any other – including systems not used on this site but still “legitimate” systems under appropriate market conditions.
My recommendation would be to break the money we have to invest into separate “tranches” and to manage each “tranche” using a different system/model.
David
Discover more from ITA Wealth Management
Subscribe to get the latest posts sent to your email.
You must be logged in to post a comment.