
Oregon Coast
Second to the Copernicus investing model, the Sector BPI Plus model ranks highest based on performance or Internal Rate of Return (IRR). When last reported, the Carson carried the least amount of risk and the other Sector BPI portfolios were not far behind. With such strong performance, why mess with a good thing? The minor tweak explained below should only further improve performance. The Sector BPI Plus model is still in the hypothesis phase, but is gradually moving toward a useful theory. No model will become “law” as I don’t think there is an investing model that works perfectly in all market conditions. Over the next few months readers can follow the Risk Ratios to see if the minor adjustment explained below improves the return while at the same time reduces risk.
Let’s move on to the minor adjustments to the Sector BPI Plus model.
Franklin Investment Quiver
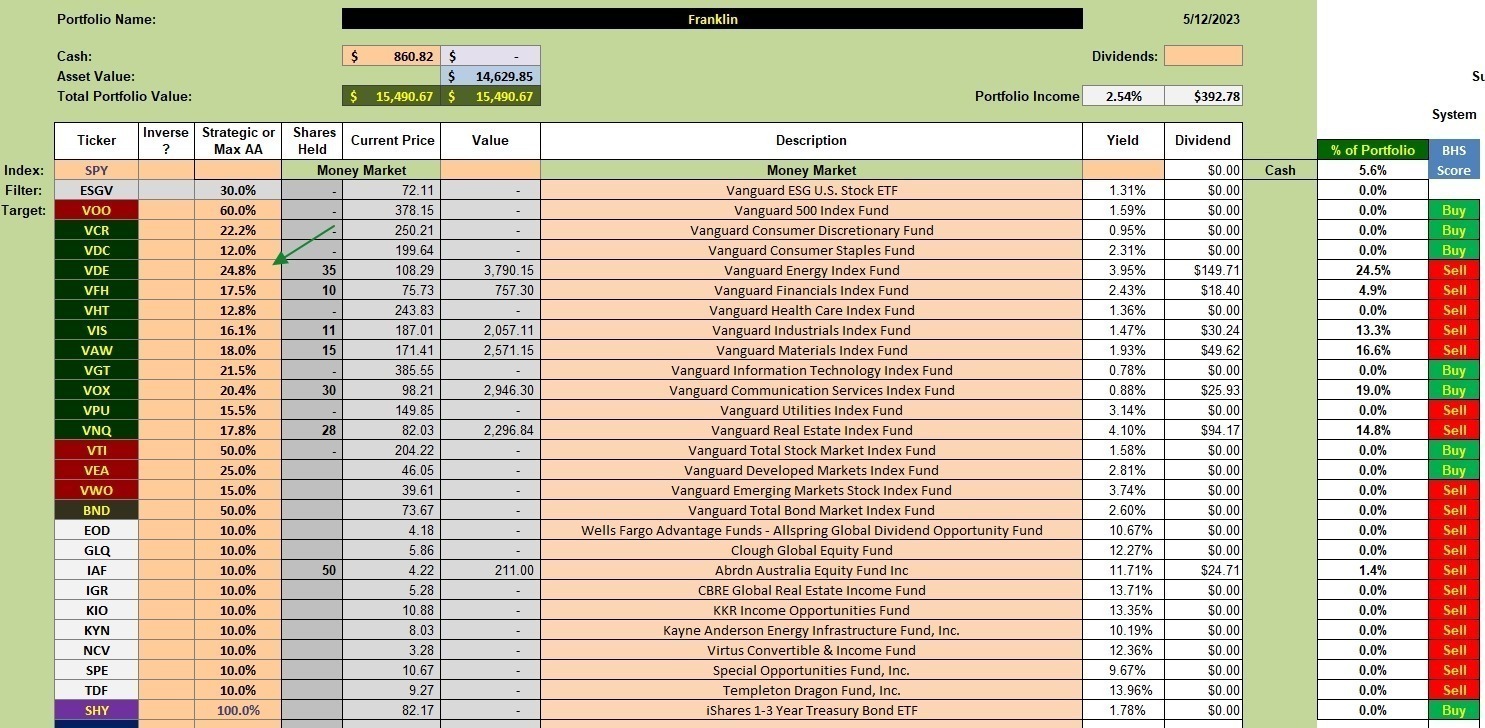
I’ll use the Franklin portfolio as the “lab mouse” since it holds fewer CEFs than any of the other Sector BPI portfolios. This will become clearer in a moment. In the following screenshot we are looking at the current investment quiver and the securities populating the Franklin.
A few things to consider or understand about the following data.
The Maximum Asset Allocation (Max AA) percentages for VTI, VEA, VWO, and BND are fixed as are the 10% values assigned to the CEFs. CEFs are the tickers with the light gray background.
The Max AA percentages for the eleven sectors (dark green background) are calculated differently. I have a variable coefficient I multiply by the three-year volatility average to come up the the sector percentages. For example, I adjust the coefficient so the highest percentage invested in any given sector comes close to 25%. Looking down the Max AA column you see that VDE is 24.8% or very close to 25%. All other sector ETFs fall into line when the most volatile sector is limited to 25% of the total portfolio.
The BPI data, published earlier this morning, provides information about investing in the various sectors. Telecom or Communication Services is a Buy so we want to hold something close to 20.4% in VOX. VOX is the ETF we use to populate the Telecom sector. Over on the right you will see that 30 shares of VOX comes out to 19.0% of the portfolio or very close to the recommended 20.4%.
Based in the BPI data this morning, if we held Technology we would place a 3% TSLO under VGT. Since the Franklin does not hold any shares of VGT this sell recommendation is moot.
Franklin Security Recommendations
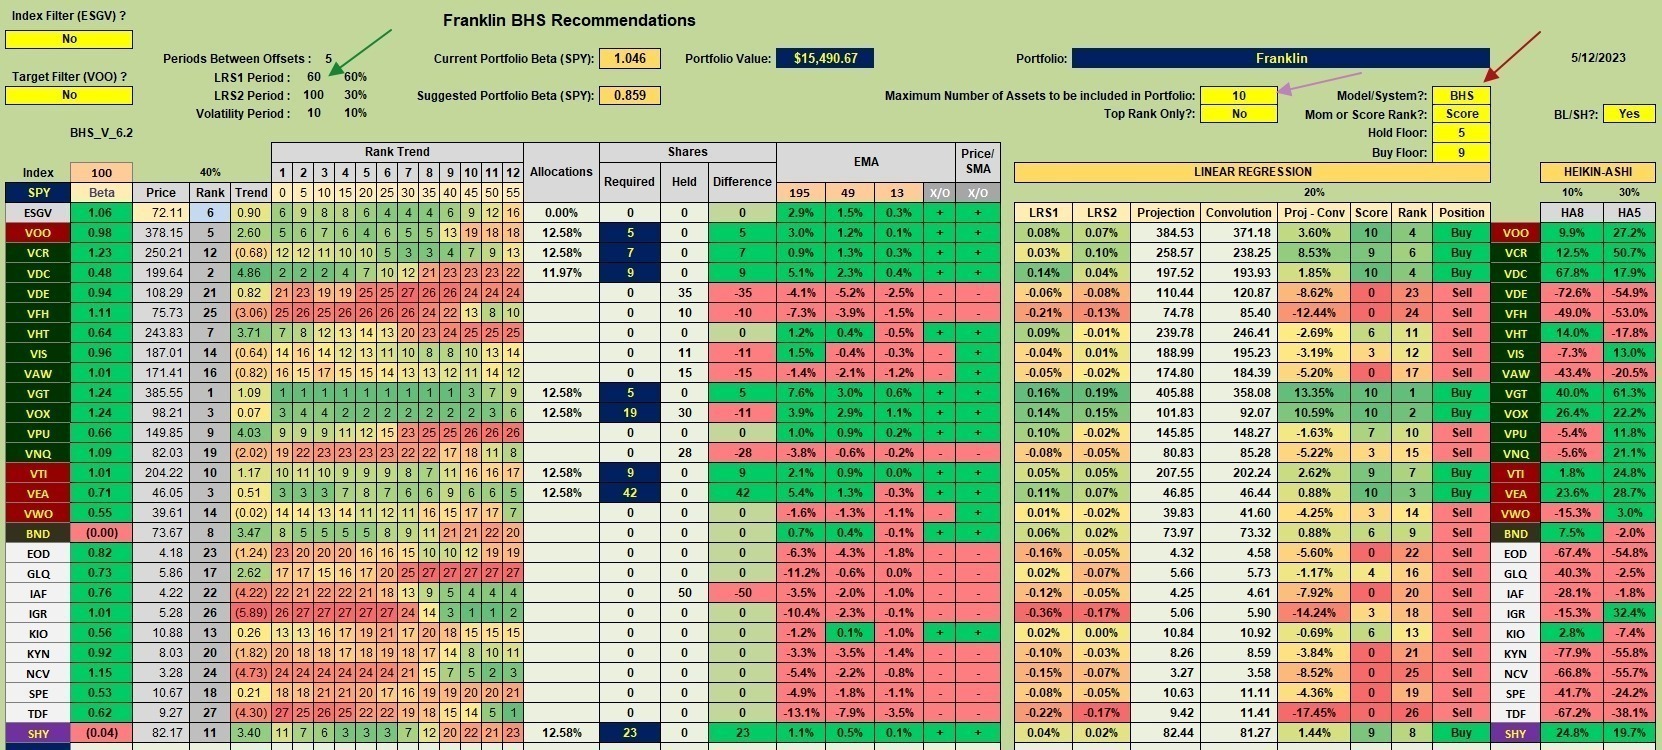
If cash is still available we move down into the Dual Momentum™ recommendation area. Since the DM model recommends holding only one asset class at a time we check to see which of VTI, VEA, VWO, or BND ranks highest. Since I am using the BHS model (see red arrow) with the Franklin I use the Rank column list in the 5th column from the right. VEA ranks higher than VTI so we use VEA as an investment vehicle, assume some cash is still available. Going back up to the Investment Quiver data above, note that VEA is limited to 25% of the total portfolio.
Only purchase DM ETFs (VTI, VEA, VWO, or BND) is they show up as a Buy.
And now we come to the minor tweak. Heretofore, I would use any remaining cash to randomly purchase shares of CEFs or securities EOD down through TDF. Using the worksheet shown below we find that no CEFs are recommended for purchase. This being the case, we do NOT purchase any CEFs. If cash is still available, leave it in the Money Market or invest in SHY which is showing up as a Buy.
Should my explanation not be clear, please post your question or comment in the Comment section provided below.
Franklin Manual Risk Adjustment
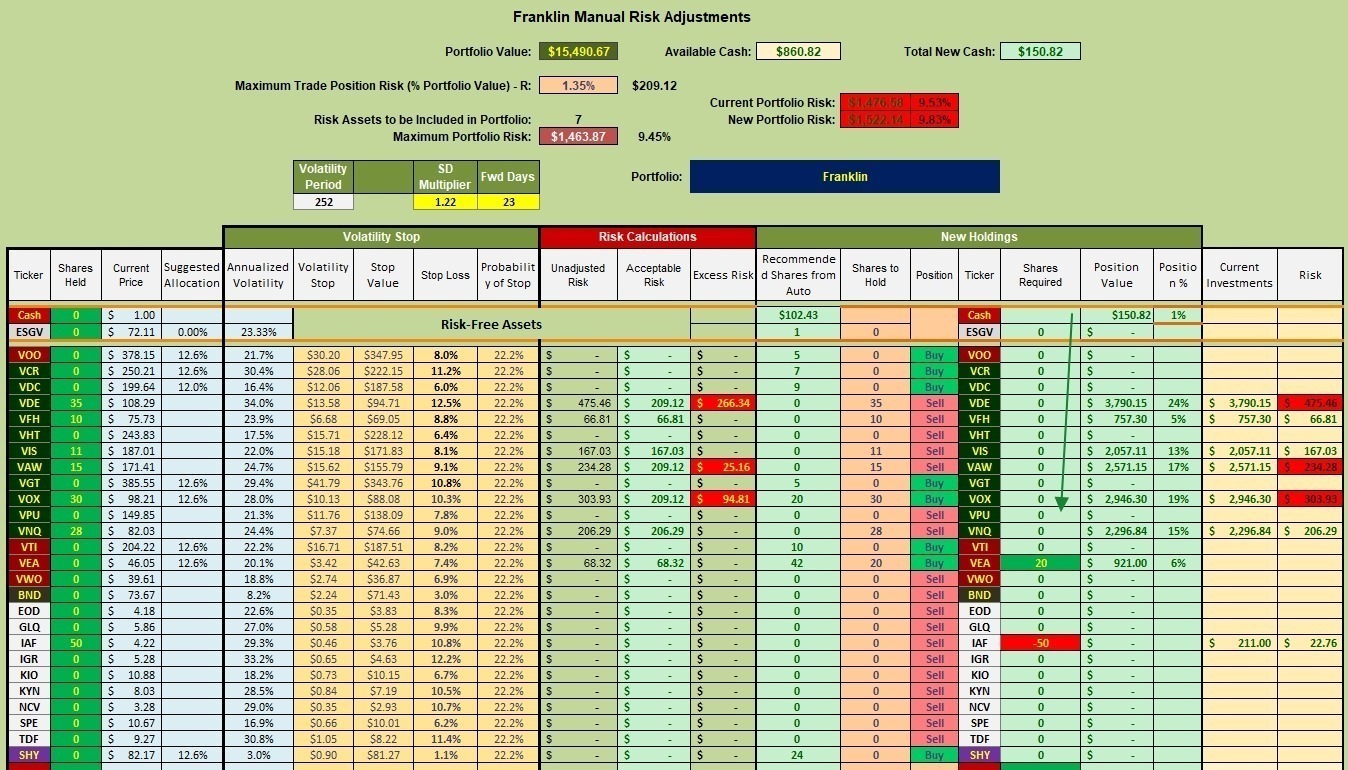
The following Manual Risk Adjustment worksheet is an excellent aid in helping investors make decisions. Based on the latest BPI recommendations and the current holdings in the Franklin, we do nothing to the sector section. Do not disturb any of those holdings.
Next we look at the DM recommendation. The Franklin holds no shares of VEA. Since IAF is a Sell, place a limit order to sell all shares and use that cash to purchase 20 shares of VEA. If the owner of the Franklin added new cash we would use that money to buy more shares of VEA until it held 25% of the total portfolio.
That concludes the analysis. Yes, it sounds a tad complicated at first, but the model is quite simple to implement when one goes through the process a few times. Keep tabs on the Carson, Franklin, Gauss, and Millikan. The management process will become more familiar as you follow these four portfolio reviews.
Here are old guidelines for managing the Sector BPI model.
Buying Guidelines For BPI Model Portfolios: 9 December 2022
Discover more from ITA Wealth Management
Subscribe to get the latest posts sent to your email.
Lowell,
I see a possible conflict in this tweak in that, when adding CEFs to our portfolio (following Bavaria) ,we would normally look for high dividends and deep discounts. This means we are bottom fishing. However, momentum investing is basically based on expected growth with evidence that the asset we are adding has upward price movement (over whatever time period we choose to use). In this case a CEF may or may not be selling at a discount. Almost certainly it won’t be trading near it’s largest discount. Are you checking for this and filtering?
David
David,
If and when cash is available and a CEF shows up as a Buy in the Kipling worksheet, I’ll check it for three variables. Order of importance. 1) Yield 2) Discount to NAV and 3) Leverage.
Which to you think is more important – Yield or Discount %?
Lowell
I don’t know the answer to that Lowell – I’ve asked myself the same question and have considered splitting a portfolio between the 2 factors – I just haven’t got around to doing it since I weight the 2 in my initial selections. But it’s a great question to ask – I wish I knew the answer 🙂
The only “obvious” additional comment is that, if the discount is not deep, there will/may be less opportunity for “growth”
… and “growth” means positive momentum ….
I should add that, since the BPI sector portion is a bottom fishing/mean reversion approach it makes sense to diversify by adding a momentum system to the mix. My only question really is whether doing this through CEFs is the right approach.
I did try using the momentum systems with CEFs for a while but found that I was missing out out on “income” – and trying to “lag” sales was difficult because of the price adjustment on ex-dividend.
Thanks for the update, I am now able to see this blog. – Lee