
Weather Station, Madeira, Spain
US equities attempted to test the all-time high at ~6100 but volume was not strong and there was not enough conviction to break through this important resistance level with trend and momentum indicators (MACD and RSI) sending mixed signals:
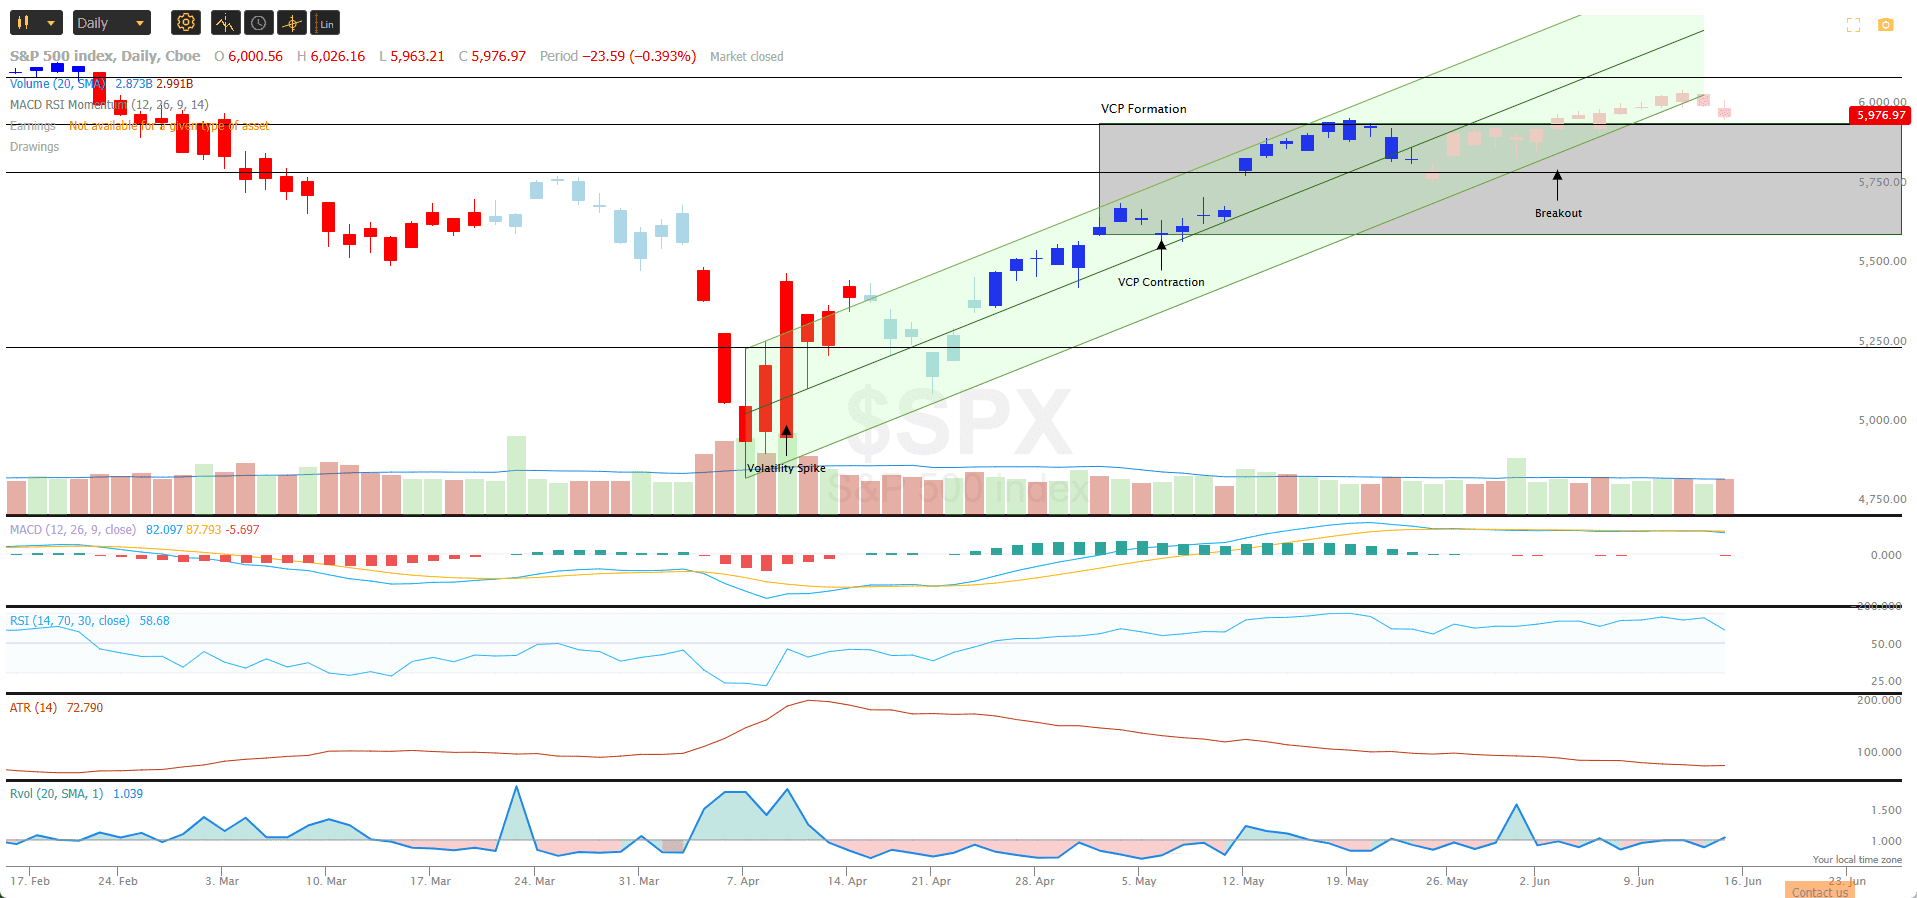
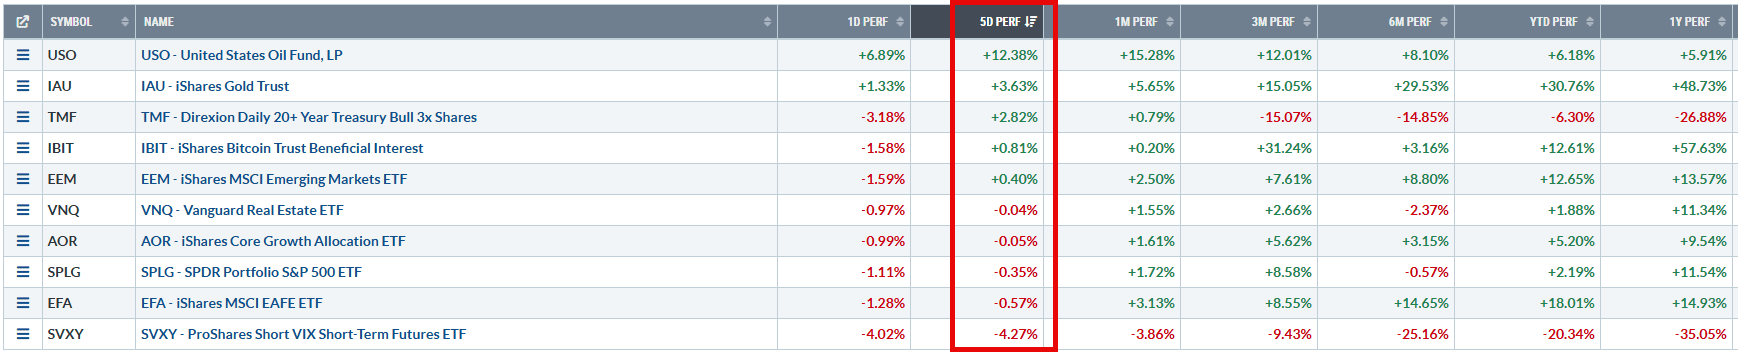
As we can see from the Average True Range (ATR) indicator in the lower panel we are still in a volatility contraction stage that often preceeds a breakout (in either direction) on above average volumes. US equities ended the week closing ~0.35% lower than last week’s Close and, compared to other major asset classes, closed towards the bottom of the list with defensive assets leading the way:
Darwin Core Portfolio Holdings:
Checking on the rankings and recommendations from the Kipling worksheet we see the following:
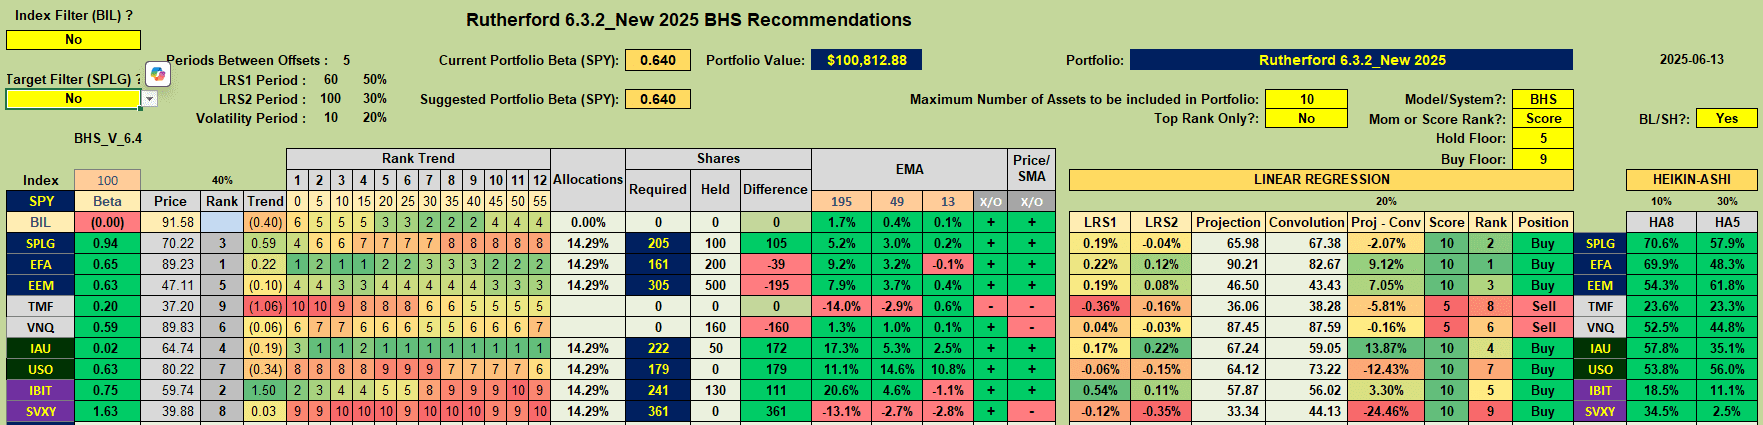 with Buy recommendations on all ETFs with the exception of TMF (Bonds) and VNQ (Real Estate).
Checking all the price charts there are no really strong signals to suggest that I should be adding new assets to the portfolio at this time and, if I tighten the “rules” (add Target Filter) , to require that assets should be looking stronger than US equities (as represented by SPLG) then the recommendations look like this:
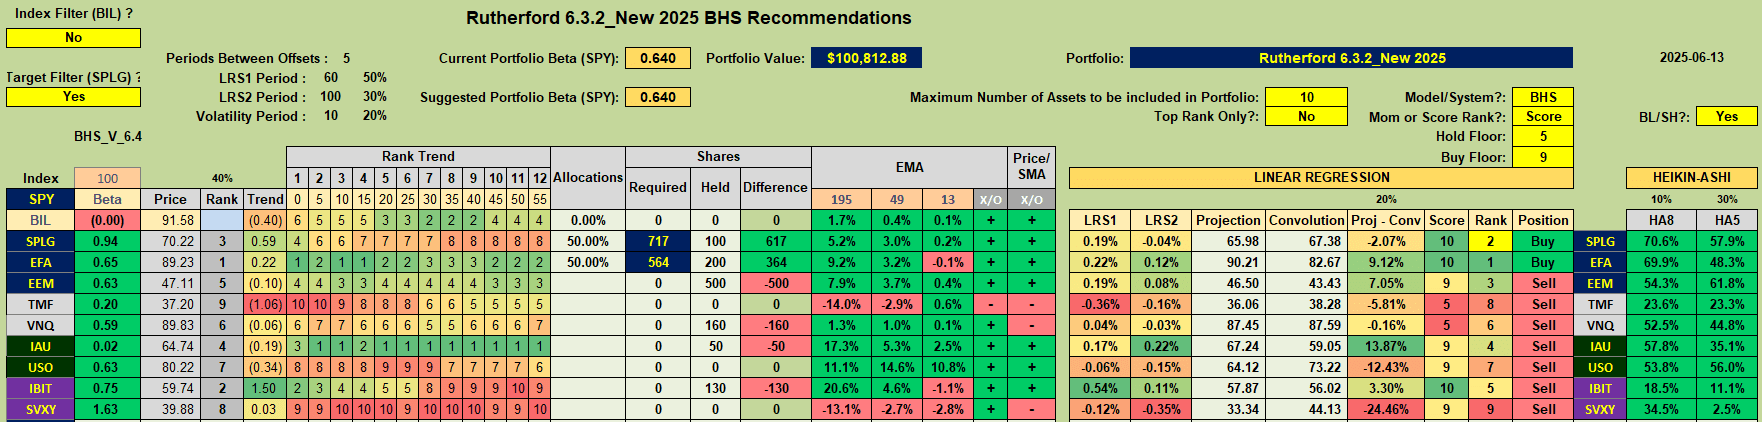 where only EFA ranks higher than SPLG. At this point I will not add new ETFs to the portfolio until the picture looks a little more convincing. On the other side of the coin, VNQ has a Sell recommendation but, as with last week’s review, VNQ does not look particularly weak (consolidating sideways and is hedged) so I will keep holding, at least for another week, at which time I will decide whether to continue to hold, reduce holdings or Sell.
Members that have been following my posts for a number of years may remember the “rotation” system that I used for a time and, although I don’t use this as a major stand-alone system anymore, I still find it useful to check the rotation graphs from time to time since this can help me make decisions when such decisions are not obvious. At the present time the rotation graphs look like this:
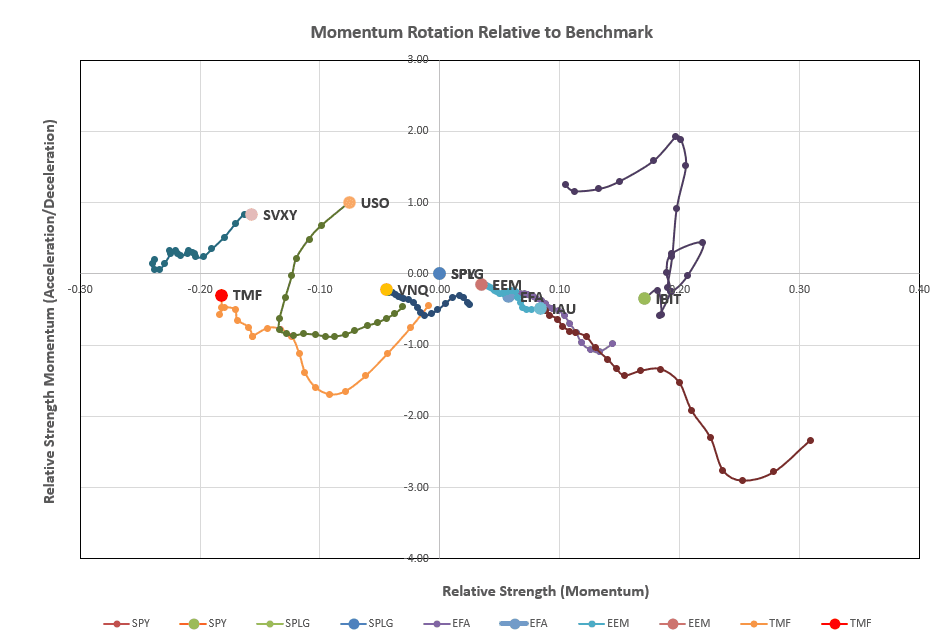 confirming the selection of IBIT, IAU, EFA, EEM and SPLG as the preferred holdings. Long term strength in these ETFs is still looking good (to the right of the vertical axis along the horizontal axis) with most ETFs (with the exception of IBIT) still recovering from the March 2025 correction (and moving upwards on the vertical axis).
So, what does this mean in terms of performance of the Darwin portfolio?
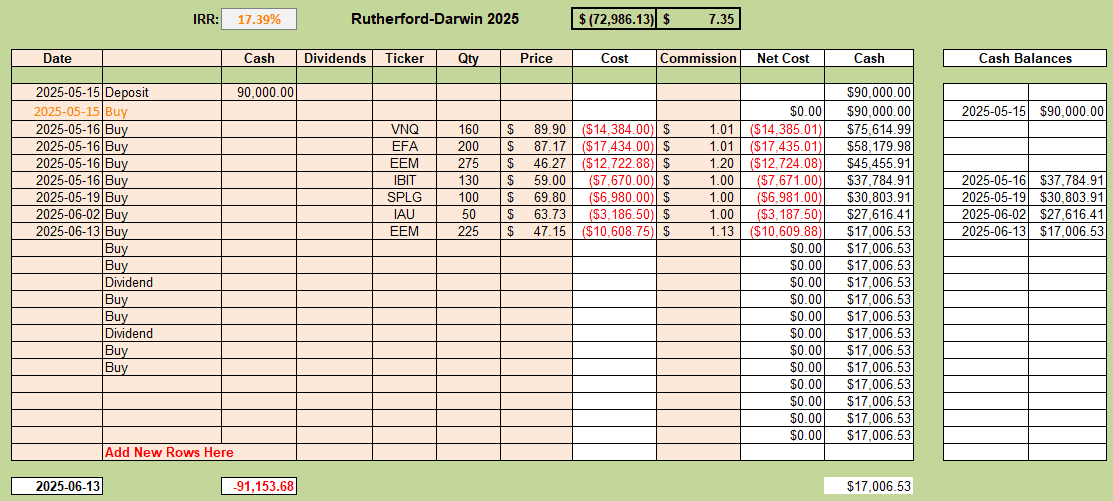 After 4 weeks, the portfolio is showing a healthy 17% Internal Rate of Return (IRR), but, of course, this is too short a length of time to take too seriously. Note the addition of 225 shares of EEM that I added to the portfolio on Friday. This ETF goes ex-Dividend on Monday (16 June) so I will now pick up the Dividend on 500 shares. This decision was made when checking the current asset allocation calculation sheet:
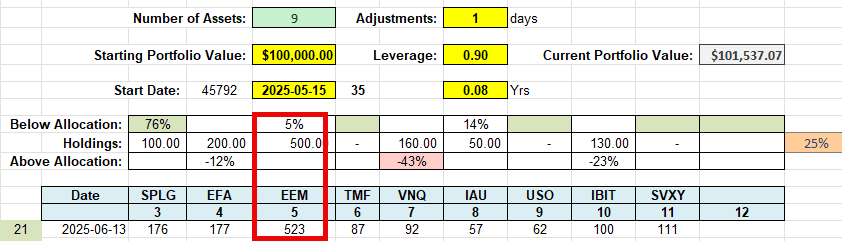 Note the current over-allocation to VNQ – as mentioned above, I will likely make an adjustment to this position either next week or after the ex-Dividend date on this ETF (end June).
Rutherford Risk Management:
If we take a look at the Risk Management of the portfolio we see that the Call Options sold on IBIT expired worthless on Friday (13 June) – so I got to keep the $108 credit received when I sold the Option. I also replaced this Option with a new Option at the same strike price ($63) expiring on 18 July. I received a $173 credit for selling this Option.
Although the Options sold against shares held in EFA and EEM did not expire until next week (20 June) these Options were In-The-Money (ITM) and both ETFs go ex-Dividend on Monday (16 June) and the Options would, almost certainly, have been exercised – meaning that I would have to give up my holdings in these ETFs and miss out on the dividends. After buying back the Options I was left with a $22 credit from EFA and a $78 debit on EEM.
This leaves me with a realized $52 net credit on the Options that were sold on IBIT, EFA and EEM. Options sold on SPLG and VNQ are still held and will expire next week (20 June):
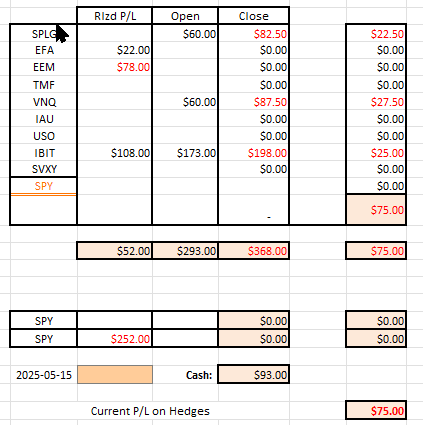
As we saw above, markets are up and the Core portfolio is showing a nice profit while the portfolio has been hedged with the hedges (realized and unrealized) presently showing a ($93 – $75) = $18 net profit. This is ideal for a risk management hedge where the market is up rather than down. With hindsight I could have been $252 better off had I not over-hedged and bought the Put Option hedge that expired worthless yesterday. Going forward, I will only be buying Puts (strong downside hedges) when US equities (SPY) are showing weakness.
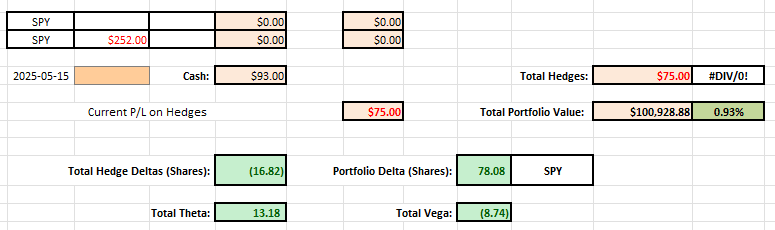
The above screenshot shows my risk management positions. The core portfolio (Beta weighted) is equivalent to holding 78 shares in SPY (at current prices) and ~17 of these shares are hedged through the Sale of Call Options. On Monday (after ex-Dividend), depending on how the charts are looking, I will likely sell more Call Options against the shares held in EFA (200) and EEM (500) to provide a stronger hedge, generate more credits and potential “income” or be available for the purchase of Put Options to provide stronger downside protection.
In the meantime I will be collecting ~$13 per day in time premium (Theta) decay.
When this is all put together the equity graph looks like this:
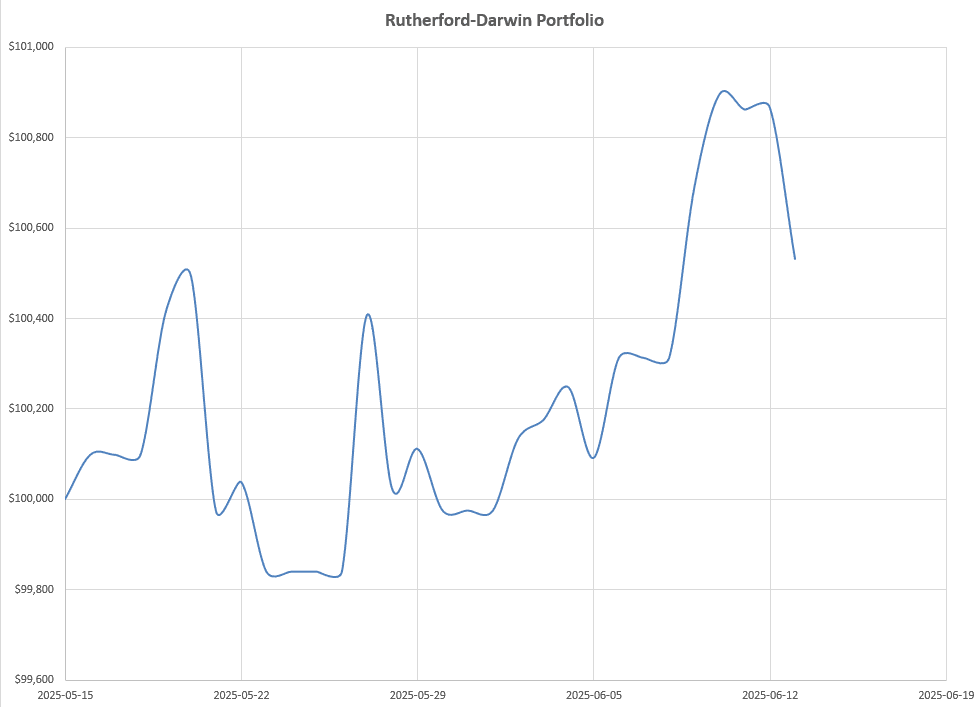 with a very comfortable 3.4% volatility.
Update 16 June 2025:
This morning I sold 2 x $90 strike Call Options in EFA, expiring on 18 July, for 0.85 to bring in $170 Credit. I also sold 5 Calls of EEM at the $49 strike and also expiring 18 July at 0.27 for an additional $135 – or $305 total credits.
My balance sheet now looks like this:
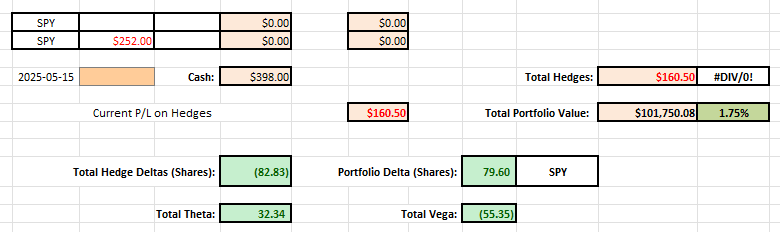 where I have $398 Cash to play with for additional protection if I need it and I am close to delta neutral that means I am not too worried about directional movement – at least a modest amount of movement. I shall also be picking up ~$32 per day in time premium decay from the sale of the Call Options. So far the portfolio is showing a profit of 1.75% after 4 weeks.
Discover more from ITA Wealth Management
Subscribe to get the latest posts sent to your email.
Leave a Comment or Question