
Jeffrey Pine atop Sentinel Dome in Yosemite National Park – circa 1972 from scanned slide. This tree died in the late 1970s.
While it is early to update the Gauss, I received numerous notices today that shares of several sector ETFs hit their TSLO strike prices. Shares of VAW and VCR were sold out of the Gauss.
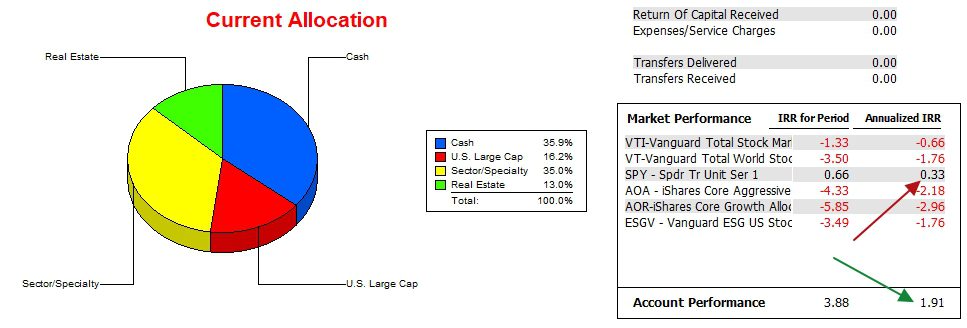
This portfolio has now been operating using the Sector BPI model for 13 months and I am interested in knowing how the sector ETFs as well as adding VTI, VOO, and ESGV to the mix impacted portfolio performance. The last two screenshots provide interesting information.
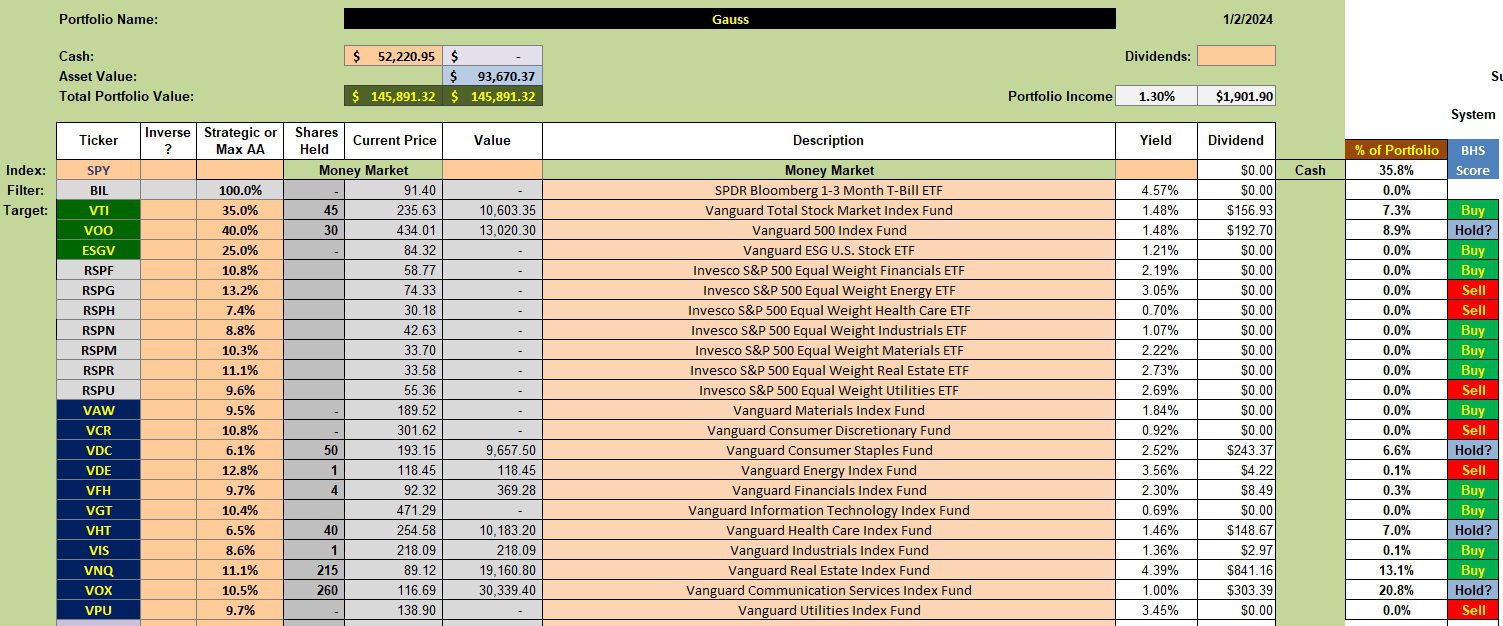
Gauss Security Holdings
The sector holdings are thinning out as TSLOs are taking out the sector ETFs. This leaves nearly 36% in cash and we need to make decisions as to what to do with this money.
Note that the Gauss is not holding any shares of ESGV and based on recommendations that come out of the Kipling spreadsheet, ESGV is the highest ranked equity of VTI, VOO, and ESGV.
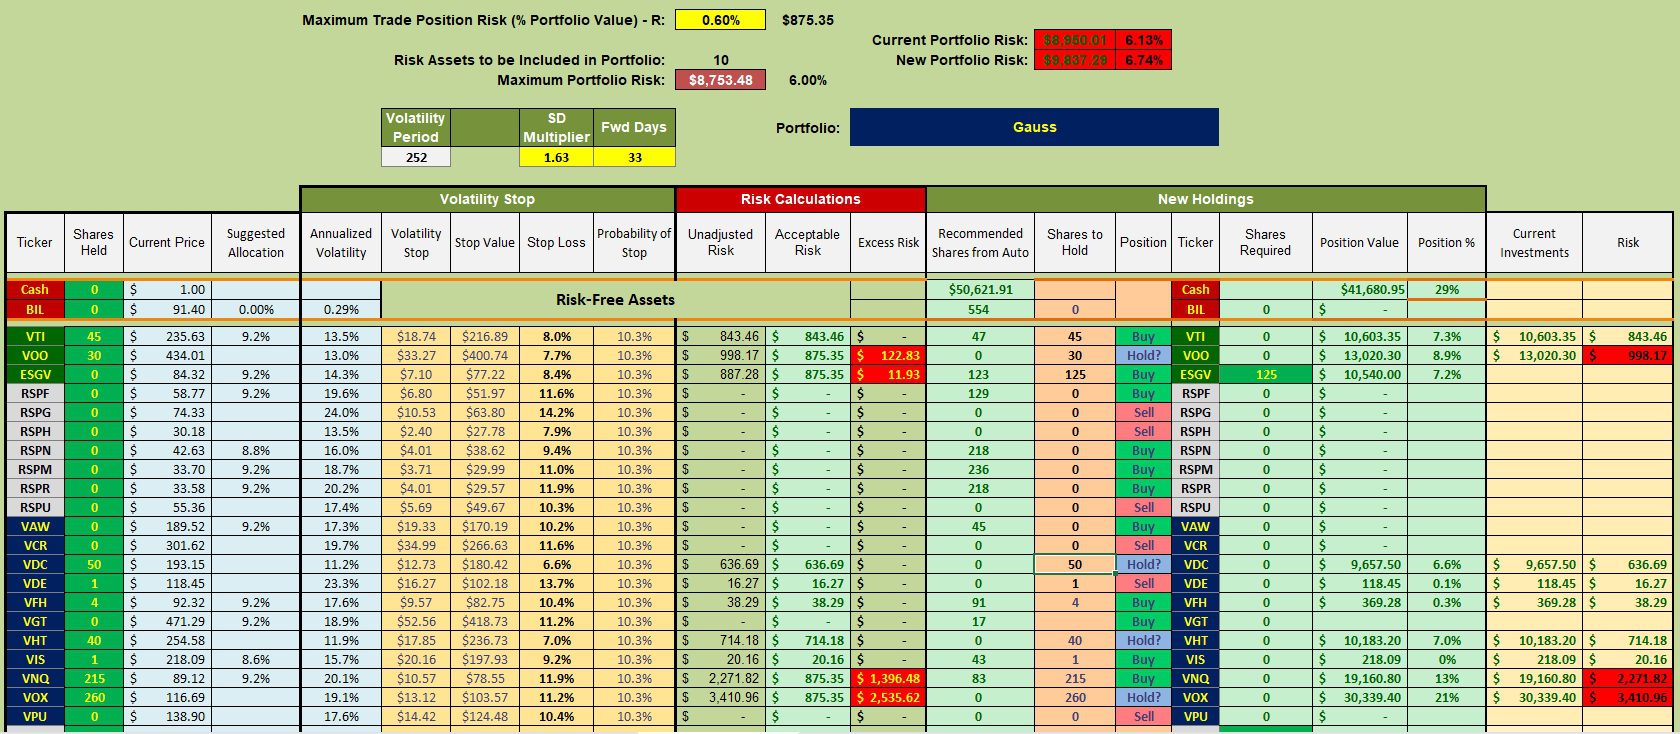
Gauss Manual Risk Adjustments
The following worksheet is one of several from the Kipling that we use for guidance. Limit orders are in place to bring ESGV up to 125 shares. The Gauss currently holds sufficient shares in VTI and VOO.
No sectors are oversold so we do nothing with those ETFs. This is a time to be patient and wait for one or more sectors to retreat into the oversold zone.
Gauss Performance Data
Over the past two plus years the Gauss holds a small lead on the SPY benchmark. The margin is even greater over other potential benchmarks.
Gauss Risk Ratios
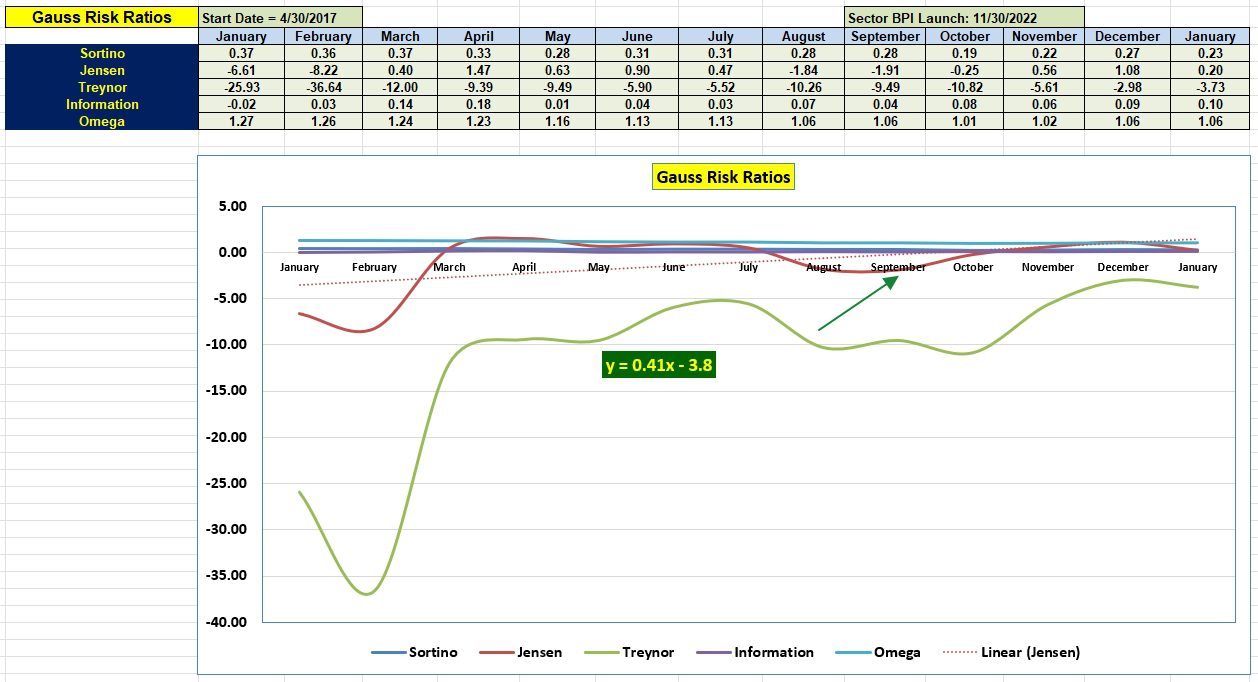
If you are new to the ITA blog, this risk information is something you will not find elsewhere. It has been stated frequently that return and risk are joined at the hip. Yet it is rare to see any information posted on how much risk a portfolio is carrying.
Of the five measurements, pay most attention to the Jensen Alpha or frequently referred to as the Jensen Performance Index. Next in importance is the Information Ratio followed by the Sortino Ratio. The Treynor is too dependent on the beta of the portfolio and Omega is very similar to the Sortino Ratio.
The 0.41 slope is a year record of the Jensen. Slope is one of the variables in portfolio performance comparisons which I plan to post sometime within the next two weeks.
Gauss Sector Portfolio Report
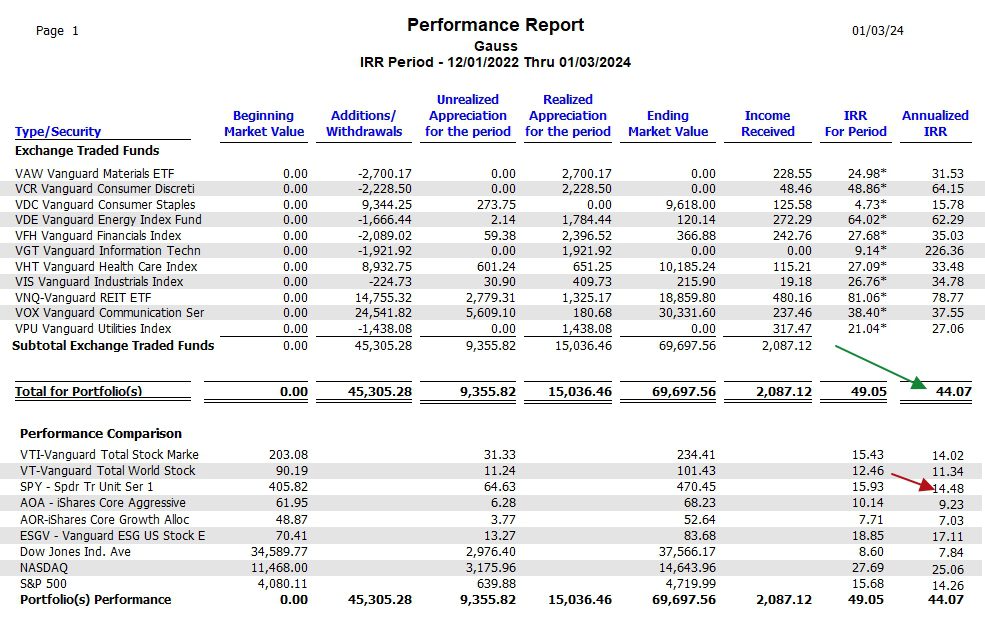
The following table is a portfolio report on how the Sector ETFs performed within the Gauss portfolio over the past 13 months. We see a 30% point separation from SPY or the S&P 500. This delta speaks well for the Sector BPI investing model.
Complete Gauss Portfolio Report
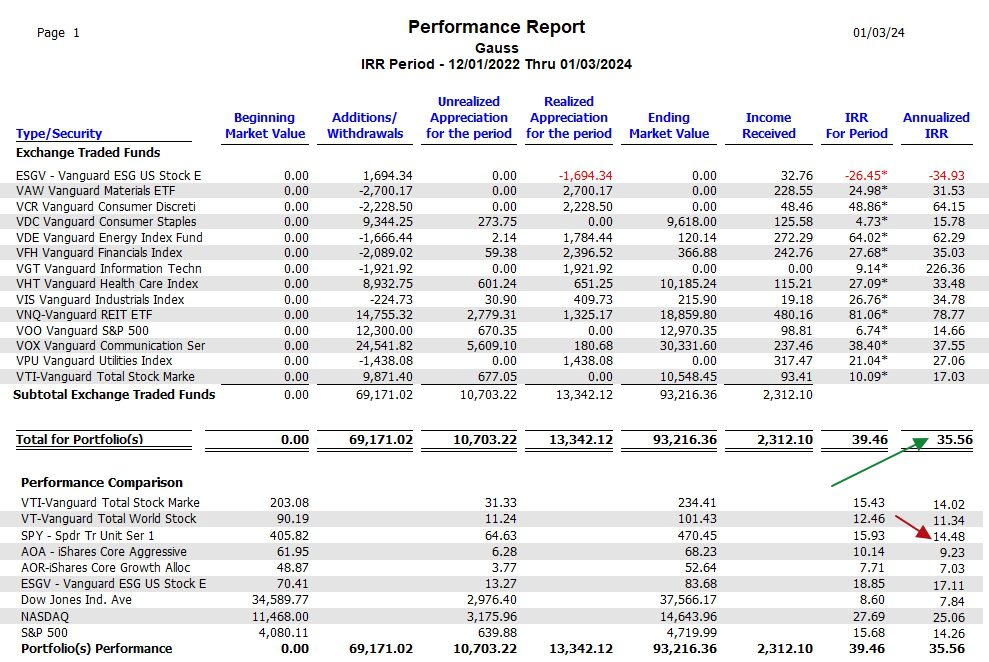
This is the first time I posted the following portfolio report. In this data table I added ESGV, VOO and VTI to the eleven sectors. Note the drop in the annualized IRR value. What this is telling us is that my use of or addition of VTI, ESGV, and VOO actually negatively impacted the overall performance. ESGV did the most damage while VOO matched SPY and VTI helped a little.
The reason for using these three U.S. Equity ETFs is to put cash to use when sector ETFs are priced in the “neutral” zone. The market could easily walk away from us while we sit in cash. It is exactly situations we are no in where VTI, VOO, and ESGV can play a major role in keep the portfolio on par with the S&P 500.
Portfolio Performance Data: 28 September 2023
Tweaking Sector BPI Plus Investing Model: Part II
Copernicus Portfolio Review: 29 December 2023
Discover more from ITA Wealth Management
Subscribe to get the latest posts sent to your email.
You must be logged in to post a comment.