
Typical scenery along Route 395 in California.
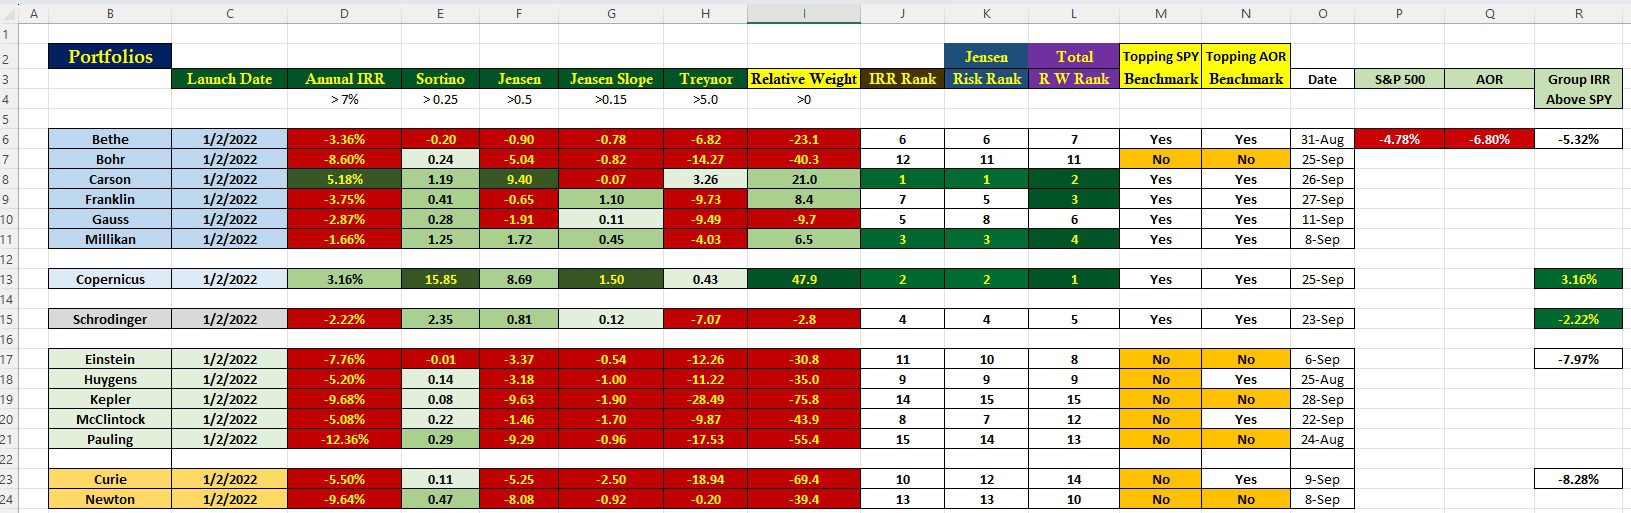
Rather than wait for the third quarter to end and all dividends recorded, I decided to post this portfolio performance data table as there is new information contained in the following. Readers, particularly those new to ITA, need to understand how to interpret the information. In the following table I am posting two different benchmarks. The one I use (SPY) and the one used by Hedgehunter (AOR). You may be using yet a different benchmark. I’ll say a bit more about benchmarks later in this post.
Portfolio Performance Comparisons
The portfolios (column B) are broken down into five groups.
- The first six are the Sector BPI Plus portfolios. Not all Sector BPI portfolios have been using this model since early in 2022.
- The Copernicus is an equity only portfolio where one saves and does not sell unless there is an emergency.
- Schrodinger is the Intelligent Portfolio (Robo Advisor) managed by computer at Schwab. This is the portfolio that requires no management skills.
- The fourth group are the Relative Strength portfolios, managed by using the Kipling spreadsheet.
- Group five are two portfolios I track for investors who prefer I not post specific monthly data.
Explanations:
- Column C is the common launch date. Most of these portfolios go back much further, but I use a common launch data so I am comparing apples to apples.
- Column D is the annualized Internal Rate of Return percentage. This information comes from the software, Investment Account Manager. IAM is a well recognized commercial product endorsed the the American Association of Individual Investors.
- Column E is the Sortino Ratio.
- Column F is the Jensen Performance Index or commonly referred to as the Jensen Alpha.
- Column G is the 13-month slope of the Jensen. Readers see this when I review portfolios on a regular basis.
- Column H is the Treynor Ratio.
- Column I is a proprietary calculation made up by giving columns D through H different weights depending on importance.
- Column J is simply a ranking of column D data. If the value ranks higher than the Schrodinger value I code the background dark green. I am using the Schrodinger as another benchmark source.
- Column K is a ranking of data found in column F or the Jensen Alpha values.
- Column L is a ranking of data found in column I or the overall Relative Weight from five different measurements.
- In column M the IRR of the portfolio is compared with the IRR of SPY. In other words is the portfolio outperforming or lagging the SPY benchmark.
- Column N does the same calculation as column M, but uses AOR as the benchmark.
- Column O is the most recent date when the portfolio was last reviewed. The IRR data in column D is current.
- Columns P and Q are the benchmark IRR values.
- Column R shows the IRR values for the different groups. As readers can see, other than the individual portfolios of Copernicus and Schrodinger, the Sector BPI Portfolios are performing best as a group.
Benchmarks
While benchmarks are important to portfolio managers they can be a tad tricky to understand. Let me use Copernicus as an example. This portfolio uses products similar to SPY for investing. Yet the portfolio is outperforming SPY by a wide margin as many shares of the equity ETFs were purchased when the market was low during the fallow 2022 period. Prior to 2017 I was using a spreadsheet known as the TLH Spreadsheet to track portfolio performance. What that spreadsheet did, and the IAM software does not do, was to “invest” the same dollar amount in the benchmark when a new investment was made in a security within the portfolio. This calculation removed the advantage or disadvantage of market timing and placed the importance on the security selected for inclusion in the portfolio.
Since it is rather easy to misinterpret benchmarks I’ve come to appreciate the Jensen Performance Index or Jensen Alpha. This calculation takes into consideration four factors. They are:
- The IRR of the portfolio.
- The IRR of the benchmark.
- The short-term interest rate of a “risk-free” treasury. I pull this value from Finance-Yahoo and use SHV as the treasury ETF.
- The portfolio beta. This calculation comes out of the Kipling spreadsheet.
If readers have any questions, post them in the Comment section provided below.
Discover more from ITA Wealth Management
Subscribe to get the latest posts sent to your email.
You must be logged in to post a comment.