
Botanic Gardens, Singapore
It was a brutal week in the US equity markets with stocks down ~5% on the week:
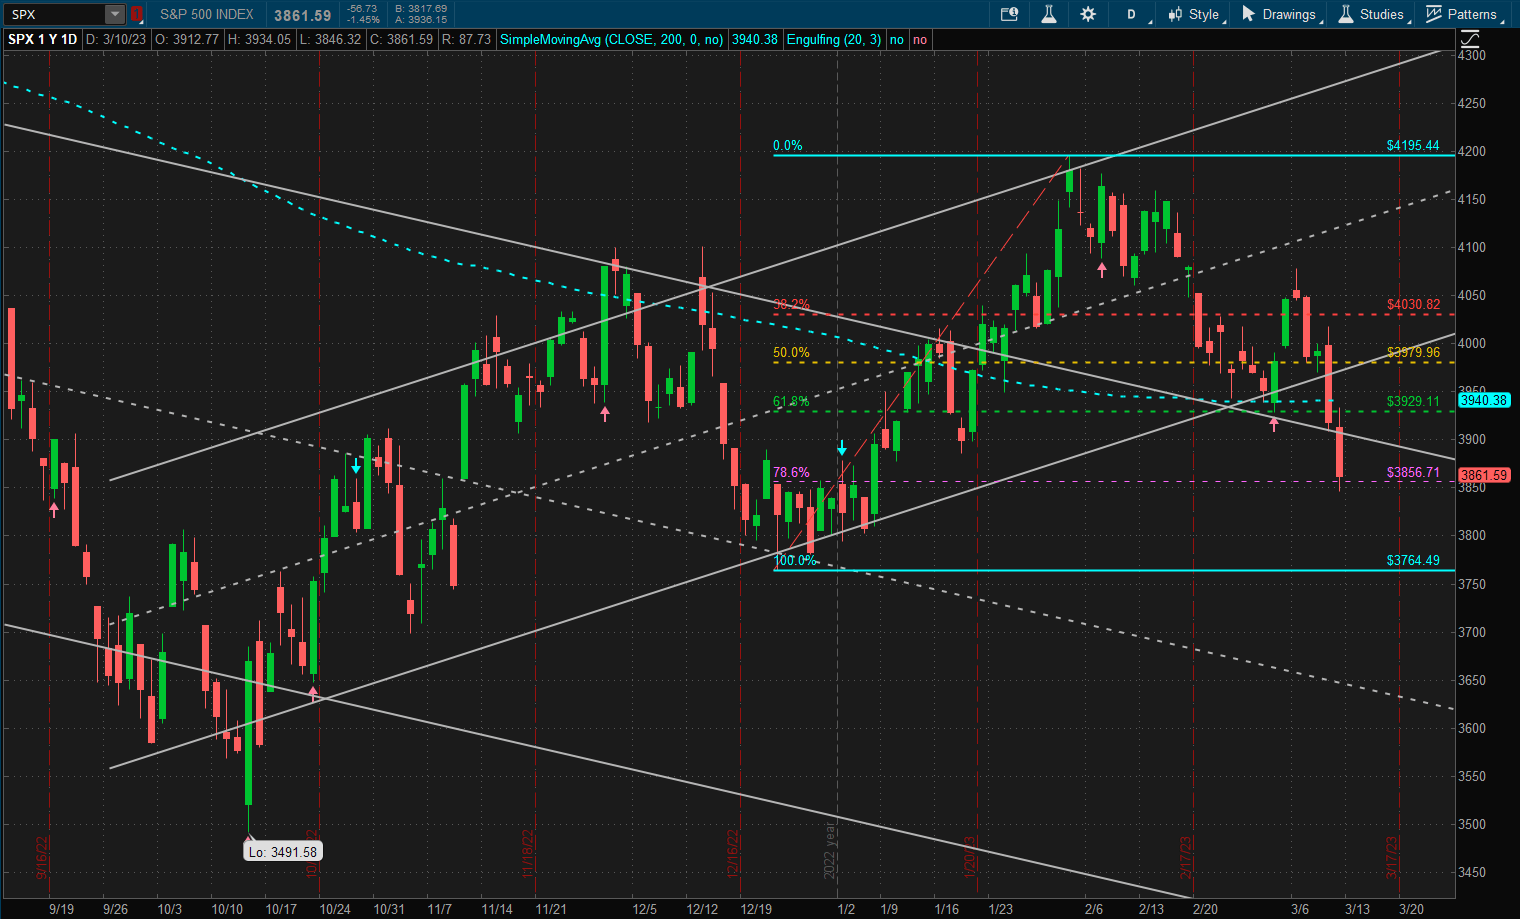 This has taken us below the 200-day Simple Moving Average (SMA) and other potential support levels at ~3940 and back into the 1 SD downtrend channel that started at the bebinning of the year. This suggests a possible test of the December lows at ~3770 (that would negate 2023 profits) and even a drop to test the October 2022 lows at ~3600 – a level well within the downtrend channel. Even though I have drawn the short-term 1 SD bullish channel that was established when we broke out of the 1 SD downtrend channel, we did not get out of the 2 SD downtrend channel established in 2022 – so it is still uncertain where we go from here. We need to break through the 4200 level (Jan pivot high) before we can feel that we are truly in a new bullish uptrend.
Bonds were the winners in this week’s asset class performance stats:
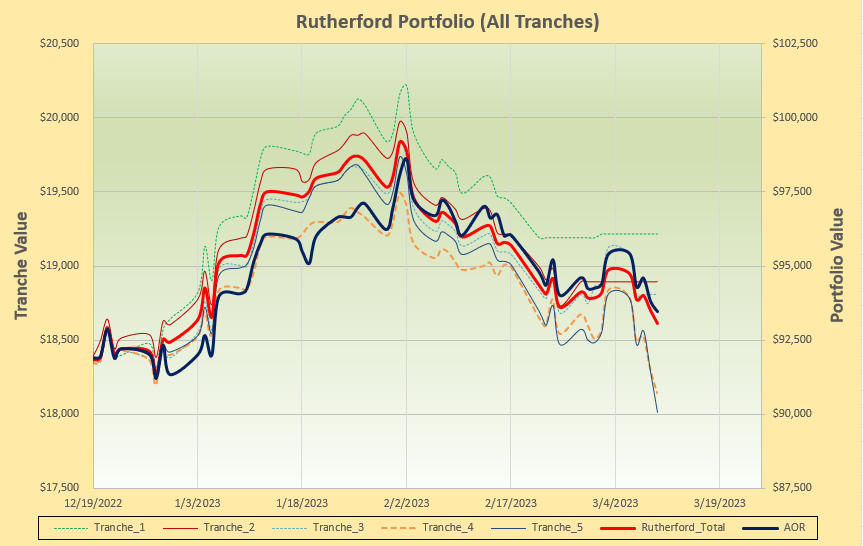
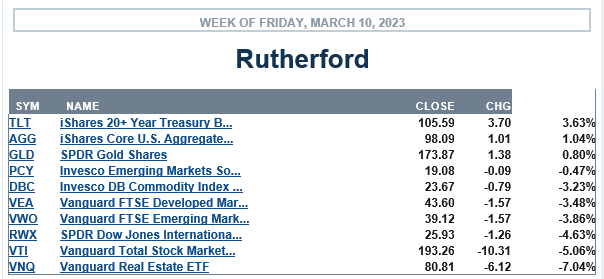 with only real estate performing worse than US equities.The Rutherford portfolio is holding 100% Cash in 3 of the 5 tranches:
 that means we missed a lot of the negative moves – although trnches 4 and 5 suffered due to significant holdings in equities and real estate:
Current rotation graphs look like this:
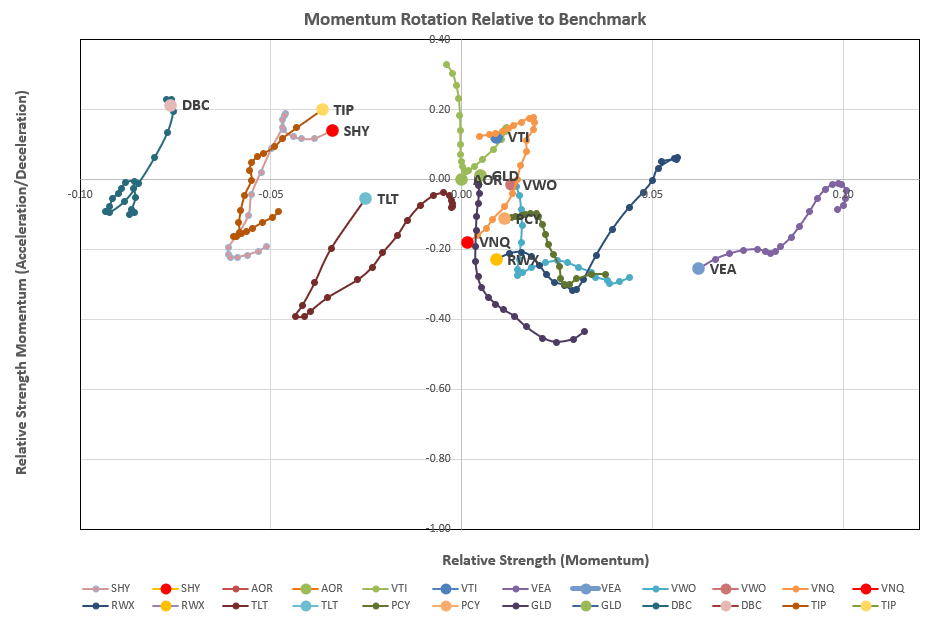 with little positive action in the top right quadrant. Consequently, recommendations from the rotation model look like this:
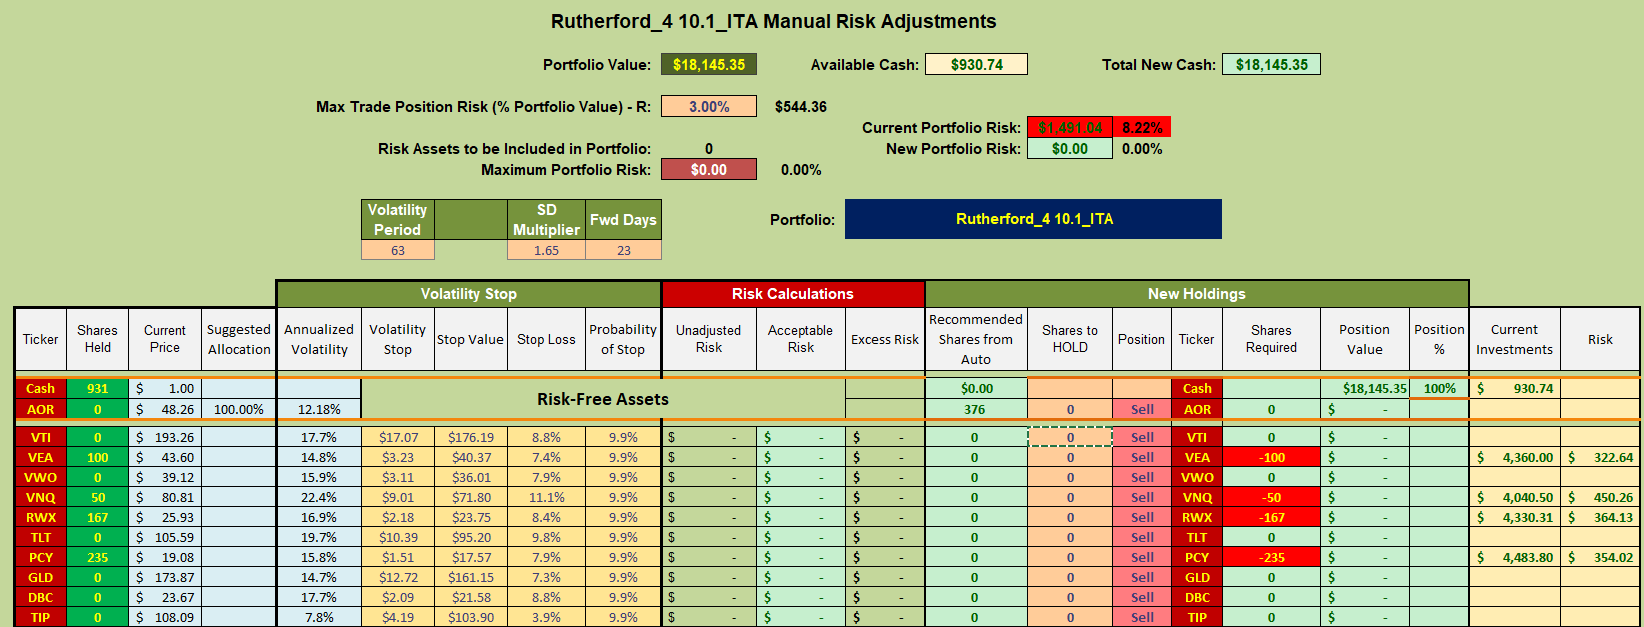
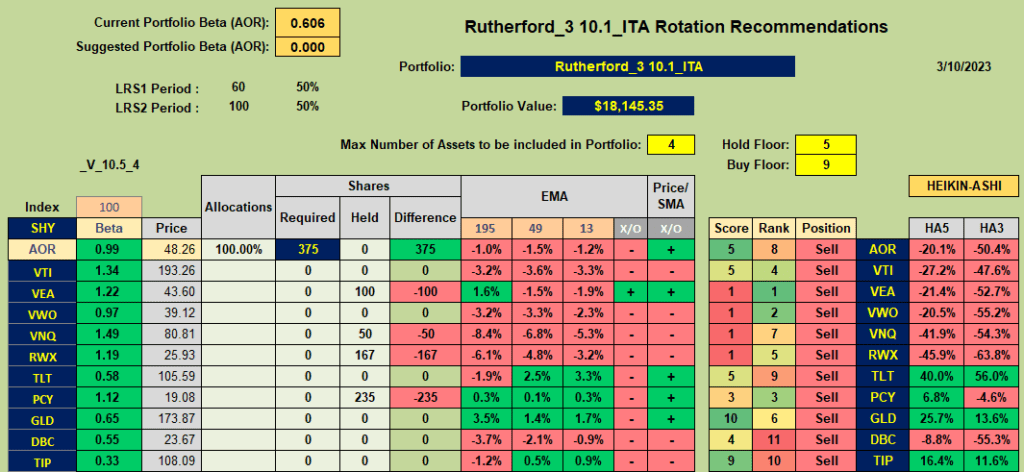 with yet another recommendation to sell all current holdings in tranche 4 (the focus of this weeks review) and to move to Cash:
Discover more from ITA Wealth Management
Subscribe to get the latest posts sent to your email.
You must be logged in to post a comment.