
Exhibition at Hillsboro Airshow.
It has been a month since I last posted portfolio performance data. Since early April all the portfolios improved slightly, but still retain the effects of a poor equities market in 2022. The launch date of 1/2/2022 is selected so as to incorporate the newest portfolios. Even so, the development of the Sector BPI Plus portfolios happened within the last seven months.
Check the following box to see where the portfolios were a month ago.
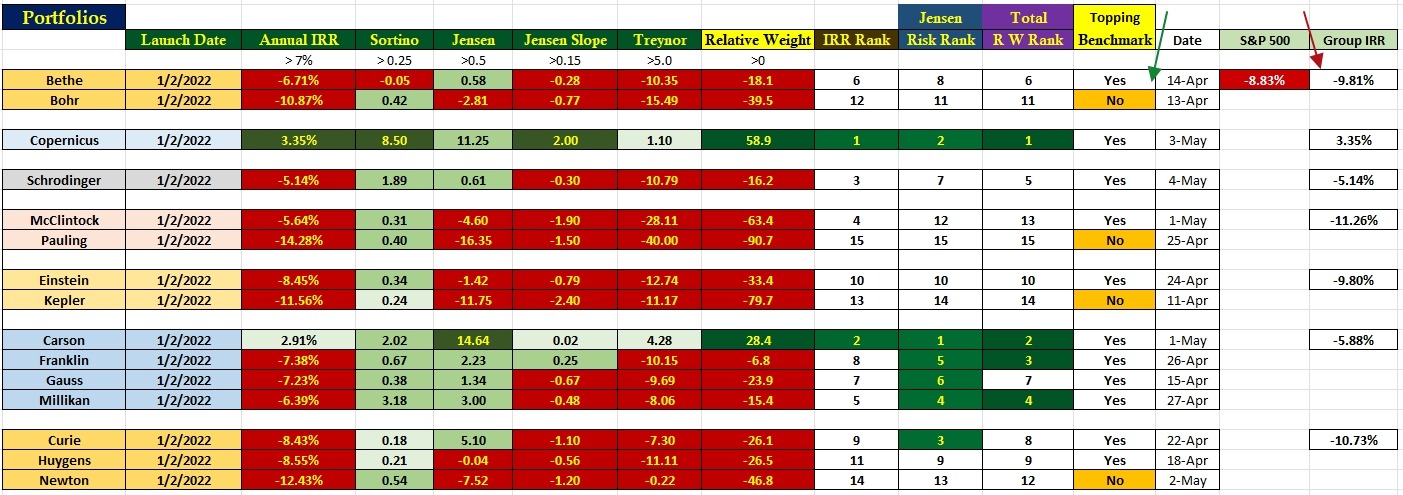
Performance Comparison Data Table
Here are a few explanations to understand the following table. The Annual IRR data (third column from the left) is accurate as of May 5, 2023. Sortino, Jensen, etc. data is accurate as of the last update identified in the third column from the right. The last column on the right (Group IRR) is current. Copernicus continues to rank as the top performer. As a group, the Sector BPI Plus portfolios (Carson, Franklin, Gauss, and Millikan) are the top performers.
Bottom performers are the Dual Momentum accounts or the McClintock and Pauling portfolios.
Pay attention to the IRR Rank, Jensen Risk Rank, and Total Relative Weight Rank data. Cells with the dark green background are indicators where the portfolio is performing above the Schrodinger. Think of the Schrodinger (computer managed) as an overall portfolio reference or portfolio benchmark.
Four of the fifteen portfolio are performing below the S&P 500 benchmark. It is interesting to note that the Sector BPI Plus portfolios are performing very well when it comes to risk. This is something to watch as we add more history to these four portfolios.
If you have any questions related the the following data, post in the Comment section provided below.
ITA Portfolios: Summarizing Investing Approaches
Portfolio Management In A Volatile and Bearish Market
2022 Guidelines for Relative Strength Portfolios
Discover more from ITA Wealth Management
Subscribe to get the latest posts sent to your email.
You must be logged in to post a comment.