
Lunchtime, Howth, Ireland
US Equities hit new all-time highs again this week with the SPX (S&P 500 Index) closing ~2% higher than last week’s close and butting it’s head against the 6800 level (previous highs ~2 weeks ago):
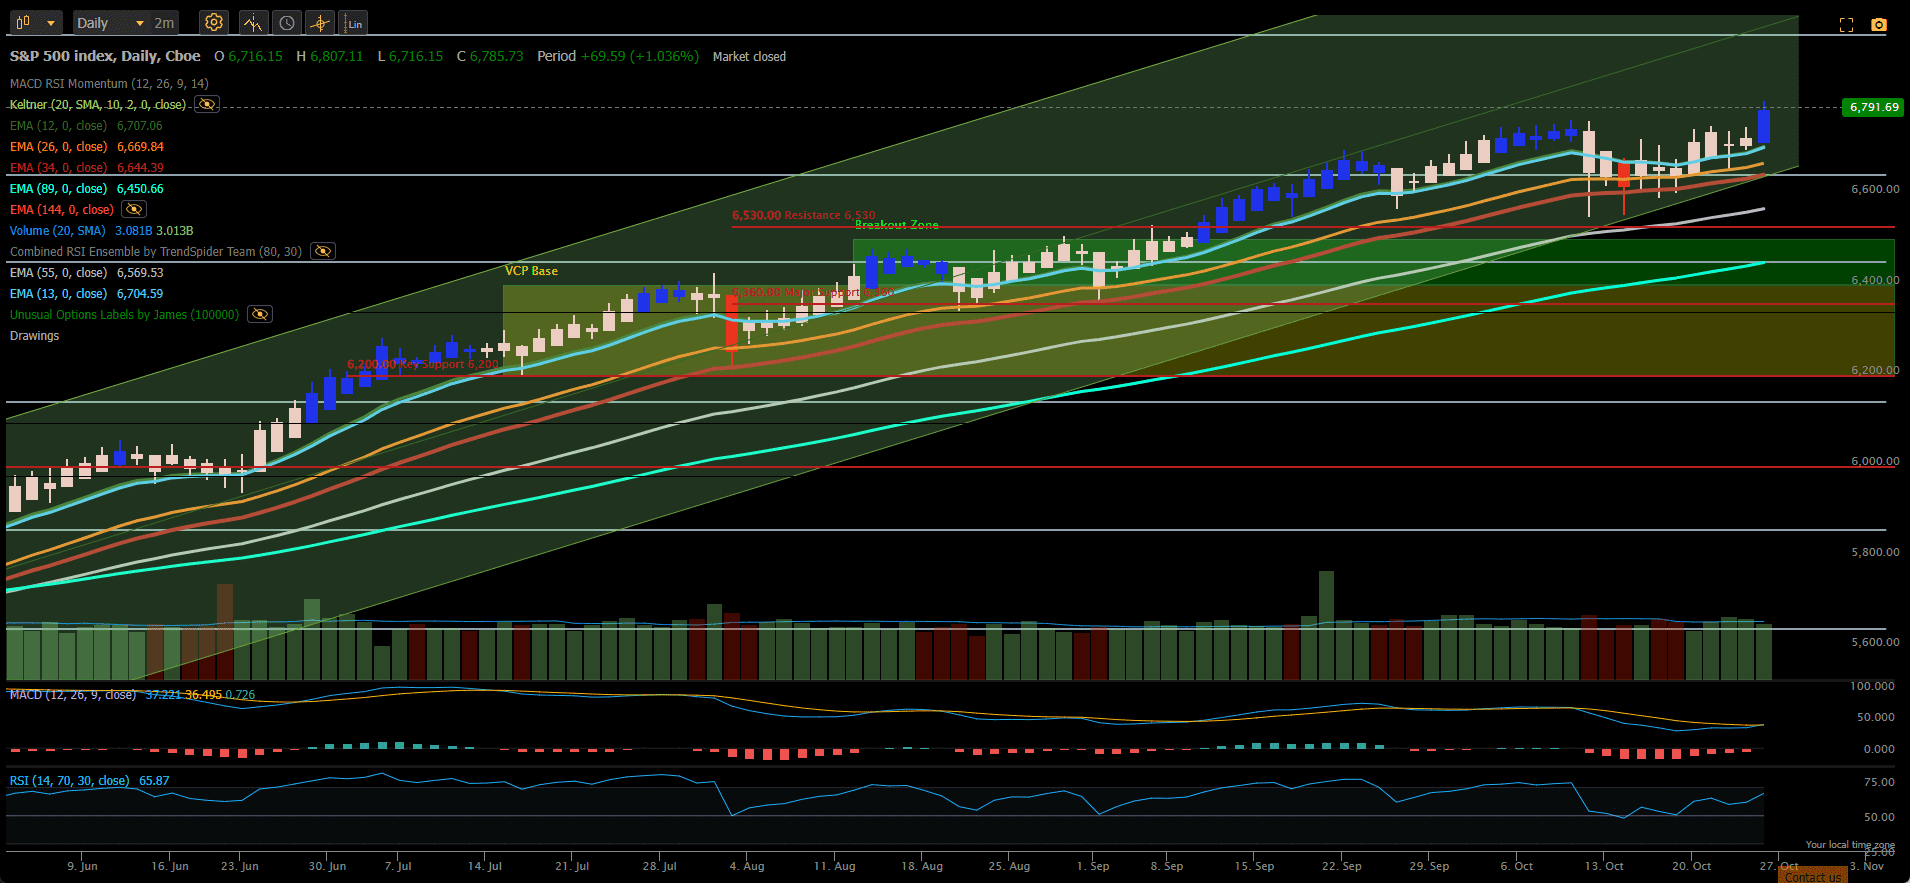 The trend is still clearly up but momentun seems to be slowing a little although both the MACD and RSI indicators are giving confirmatory positive momentum signals.
Relative to other major asset classes:
 US equities SPLG) remain in the center of the pack with Oil (USO) showing as the strongest sector this week and Gold (IAU) pulling back from recent strength.
The Darwin Portfolio is a diversified portfolio of selected ETFs from all the major asset classes and, as such, is not solely dependent on the parformance of US equities. A Trend/Momentum analysis generates the following recommendations:
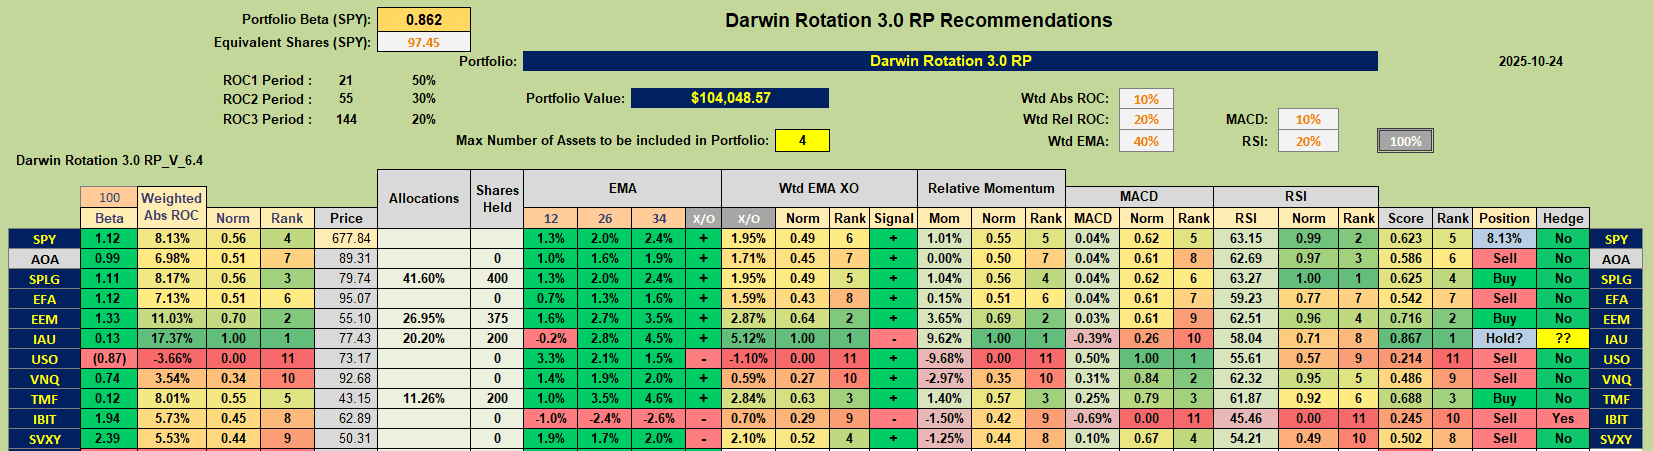
where we see Buy recommendations for SPLG (US Equities), EEM (Emerging Market Equities) and TMF (US Treasuries) and a Hold recommendation for Gold (IAU). These are the ETFs currently held in the portfolio so there is currently no need to adjust this – unless we would like to change the allocation levels.
I have now added an analysis sheet for volatility targeting to generate a Risk Parity portfolio with a 2% (of total portfolio value) volatility target for each asset held in the portfolio. Current calculations show the following allocations suggested to achieve this level of volatility/risk:
 As we can see from the above table I am currently a little over-allocated in all assets currently held in the portfolio (compare values in row 3 with values in bottom row). The above calculations are based on the use of the average volatility over the past 63 days (3 months) and there is no correction for the current volatility (that might be higher or lower than this average) as I had been using in the past. I may re-introduce this again sometime in the future but it is a subtle modification, requiring more calculations, that is not likely to impact performance markedly. I will therefore keep it relatively simple/straightforward for now.
Also, although I am slightly over-allocated in current holdings based on the volatility target numbers, I am still only ~70% invested:
 so I will not adjust lower at this point.
After 3 weeks, the portfolio is showing an IRR (Internal Rate of Return) performance of 20.75% with 10.5% volatility. The time period is too small to take these numbers too seriously at present, and I would expect both numbers to fall lower over the longer term. However, if I could maintain a 2.0 Sharpe Ratio (Return/Volatility) I would be quite happy with that level of risk-adjusted return.
Performance to date looks like this:
 although I have no firm plans for adjustments I will be watching Gold (IAU) and may decide to Hedge a little by selling Call Options against current holdings. Although IAU is still ranked #1 as a result of it’s longer term performance, the recent pullback may warrant a little insurance:
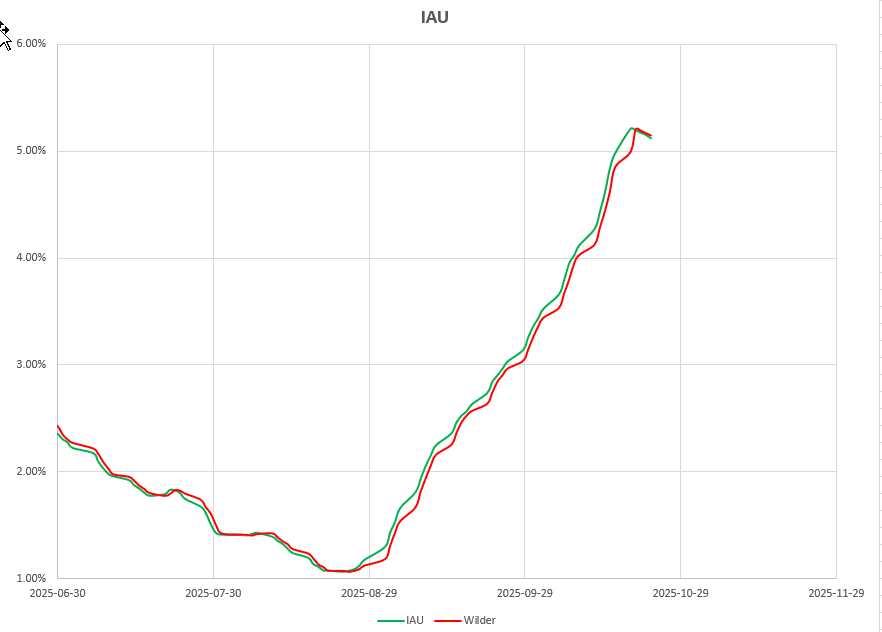 The above figure shows a plot of the trend strength (green line) plotted together with a Wilder smoothed average of this strength (red line) as a trigger signal. If the green line drops significantly below the red line it is likely time to hedge to give a little wiggle room before deciding to Sell.
On the other hand, SPLG and EEM are currently hedged but are showing a little more short-term strength:
 so it may be appropriate to take off the hedges and Buy back the Options that were sold against them that are presently losing a little money and possibly limiting future profits from the underlying – although they are still slightly Out-of-The-Money (OTM) and not limiting significantly. Also, although the trend is still positive it has been weakening since the end of July so the insurance is still relatively attractive. The above screenshot shows the graph for SPLG but the graph for EEM is virtually identical.
These are the assets that I will be watching closely over the next week.
Discover more from ITA Wealth Management
Subscribe to get the latest posts sent to your email.
Leave a Comment or Question