
Ireland or Wales
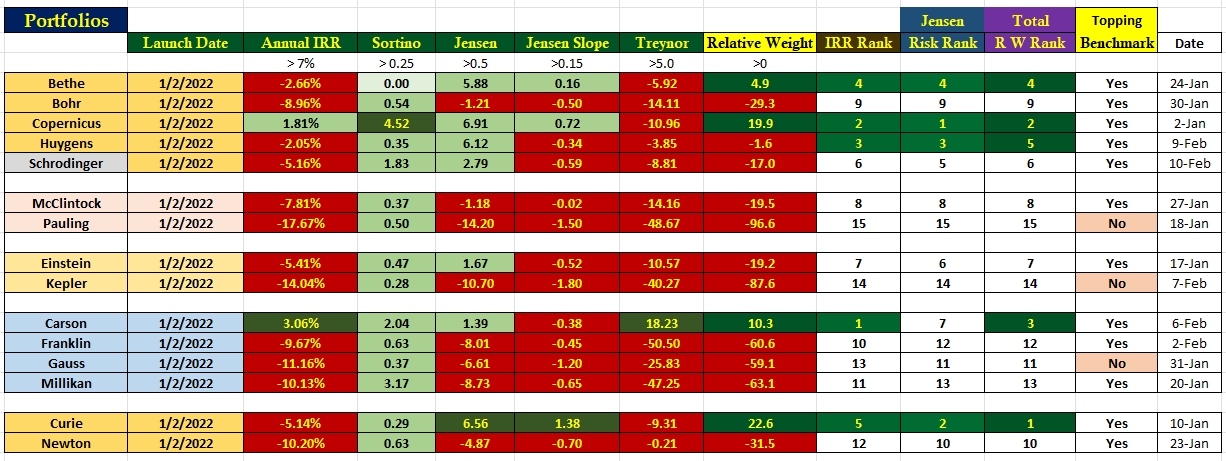
The following portfolio performance table includes annualized Internal Rate of Return (IRR) data as well as risk information for the 15 portfolios I’m tracking here on the ITA blog. The IRR data (third column from the left) is accurate as of February 10th. The risk or remaining data is accurate as of the date on the right or when each portfolio was last reviewed.
Carson is the top IRR performer whereas Curie is the overall top performer when risk enters the equation. I see a color error with the Copernicus as the Jensen 6.91 should show the dark green background instead of the Curie’s 6.56 value. More explanations below.
Portfolio Performance Data
How does one interpret the following data? The Annual IRR column is straight forward. Currently, only Copernicus and Carson are positive. Keep in mind we are coming off a poor year for equities. The AOA benchmark lost over 10% during the period shown in the table below. This brings readers to the second column from the right. Twelve of the 15 portfolios are topping the AOA benchmark. The Millikan and Newton barely make the cut, but both are a tad above the AOA benchmark.
I use the Schrodinger as a portfolio benchmark. Five portfolios have a higher IRR value than the Schrodinger. Check the fifth column from the right. Only four portfolios (Copernicus, Curie, Huygens, and Bethe) score higher than the Schrodinger when comparing with the Jensen Performance Index or sometimes referred to as the Jensen Alpha.
The portfolios are broken down into different management styles.
- Bethe and Bohr are growth and income combination portfolios. They are essentially, Buy and Hold type portfolios. Turnover is limited.
- Copernicus is also a Buy and Hold portfolio where we purchase only broad U.S. Equities such as SPY, VTI, etc. The goal is to never sell shares. This approach worked very well in 2022.
- Huygens is another Buy and Hold as are Curie and Newton. These three portfolios are income driven and are populated using Closed-End-Funds (CEFs).
- McClintock and Pauling are Dual Momentum™ style portfolios. The Franklin and Gauss were also DM portfolios for most of 2022. Due to poor performance I shifted them over to the Sector BPI model in late 2022.
- Einstein and Kepler are Relative Strength or Relative Momentum style portfolios.
- The next group or Carson through Millikan are new. These four portfolios are managed using the Sector BPI Model. This data requires additional explanation as these portfolios were only launched late last year. Most of the data includes information from 2022 when they were managed using a different model. With these four portfolios I’m paying particular attention to how they perform from portfolio update to the next update. In other words, is the Sector BPI approach working as anticipated. We are at least a year away from knowing if the Sector BPI model is viable.
Relative Portfolio Performance: 8 April 2021
If readers have any questions or comments, post them in the Comment section provided. While there is an abundance of red in the data table, we need to keep in mind that 2022 was a difficult year for equities. This is why portfolio bench-marking is so important.
Risk Ratio information such as the Sortino, Jensen, and Treynor is unique to the ITA Wealth Management blog. I know of no other site that provides this type of portfolio information.
The data table also points out the importance of portfolio diversification. A general conclusion, when taking a broad look, long-term investing or Buy and Hold seems to be the best investing approach. It is very difficult beating the market. This is not to say there are no sophisticated approaches that will perform much better. There are.
Investors looking for the most basic of investing models need look no further than the Schrodinger and Copernicus. Both investing models rank near the top of the group.
Discover more from ITA Wealth Management
Subscribe to get the latest posts sent to your email.
Additional comment: As a group, the 15 portfolios outperformed the S&P 500 by nearly four (4) percentage points.
Only the Kepler and Pauling failed to outperformed the S&P 500 over the period examined in the above data table.
Lowell