
Edinburgh, Scotland
It was a predictable week in US equity markets with the SPX (S&P 500 Index) testing the psychologically important 6000 “round number” level:

At this point we will have to see whether there is any follow through to test the February all-time highs at ~6120. Since the correction in March we have seen a classical “Volatility Correction Pattern” (VCP) with volatility dropping and prices consolidating. This is a common setup for a potential breakout – usually, and preferably, on high volume, to show conviction. Although there has been an attempt to break out of the consolidation zone this has not been accompanied by high volume – only average volume – so we wait for more evidence.
US markets closed ~ 1.6% higher than last week’s close that placed this asset class in the middle of the pack:
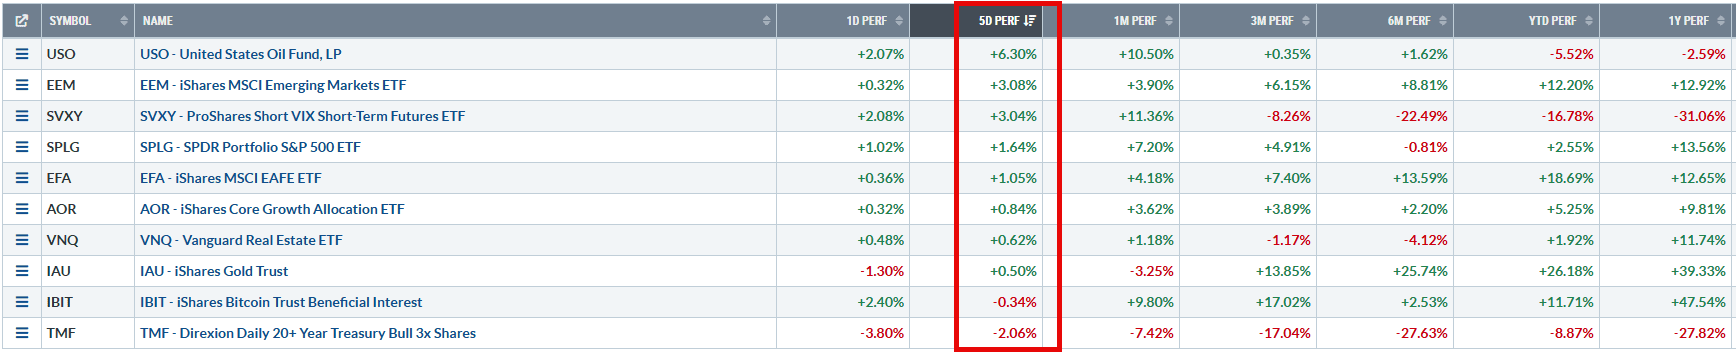
with Oil (USO) leading the way and Bonds (TMF) backing off.
I’ll start this review with a look at the Darwin portion of the portfolio that is showing nice performance:

The portfolio has only been running for 3 weeks, so we can’t take the numbers too seriously, but the current calculated Internal Rate of Return (IRR) is showing a 13.5% growth rate.
Checking the Kipling worksheet for rankings and recommendations, based on measurements of “momentum” on long- and short-term time frames, we see the following:

with Buy recommendation for SPLG, EFA, EEM (all equity-class ETFs) and IAU (Gold) and a Hold recommendation on IBIT (that pulled back a bit in the last week). These four ETFs are currently held in the portfolio along with VNQ that is showing as a recommended Sell.
However, a check of the technical charts shows that the case for selling VNQ is not strong:
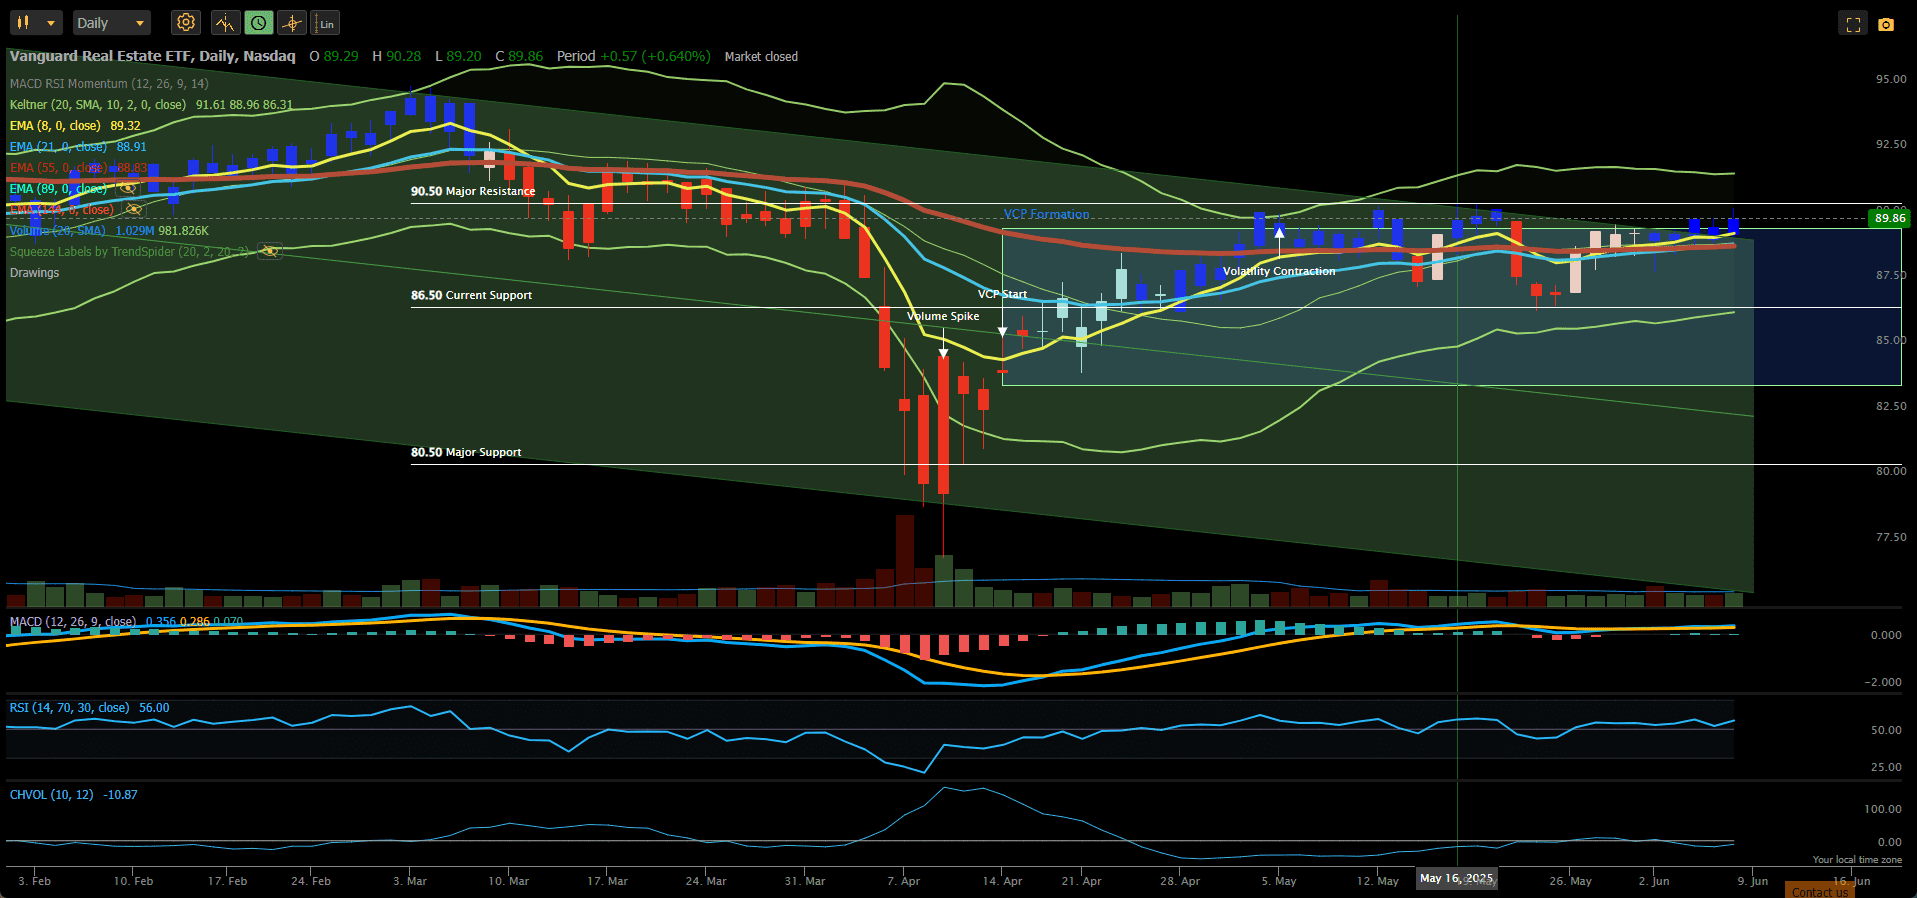
VNQ is showing a VCP setup pattern (as described above for SPX) with consolidation at the top of the VCP zone at ~$90. The candles are blue – that signals bullish agreement from the MACD and RSI indicators – with price closing above the 8-, 21- and 55-period Exponential Moving Averages and the EMAs themselves, although in close proximity to each other, are stacked in bullish alignment.
Checking on the current allocation calculations:

we see that VNQ is slightly over-allocated – so I might consider reducing to 100 shares. SPLG and EEM are slightly under-allocated, and I might seriously consider increasing holdings in EEM to 300 on any signs of continuing strength. At the present time the latter ETFs are also in a holding consolidation pattern, with mixed signals (white candles) from the MACD and RSI indicators. I will continue to monitor these ETFs, but I do not want to over-trade these positions.
This portfolio is “hedged” through the sale of Call Options on all but IAU and the Purchase of Put Options for insurance. As with any other form of insurance we don’t expect to make money from this (although that would be nice) but we aim to manage risk and reduce draw-downs.
Summary:
The Darwin Portfolio (Maximum 90% portfolio value allocation):

is showing a ~0.7% return on a 60% allocation of available funds.
The “hedges” are currently showing a loss with only the IBIT Calls in positive territory. However, this is not too concerning since “income” from the short Call positions is dependent on the decay of time premium – and we have two weeks before expiration on 20 June:

Overall, the situation looks like this:

where we can see that I am over-hedged (minus 103 Deltas on the hedges against plus 69 Deltas from the ETF holdings). With SPY not showing signs of obvious weakness, I probably should have held off on the SPY Put hedge (for more serious pullback/correction) and saved $252 – but I wanted to show an example of all the strategies that I will be using to manage this portfolio.
The Theta of ~14 means that we will pick up ~$14 per day of time decay from the sale of the Call Options.
Graphically, performance of the total portfolio to date looks like this:
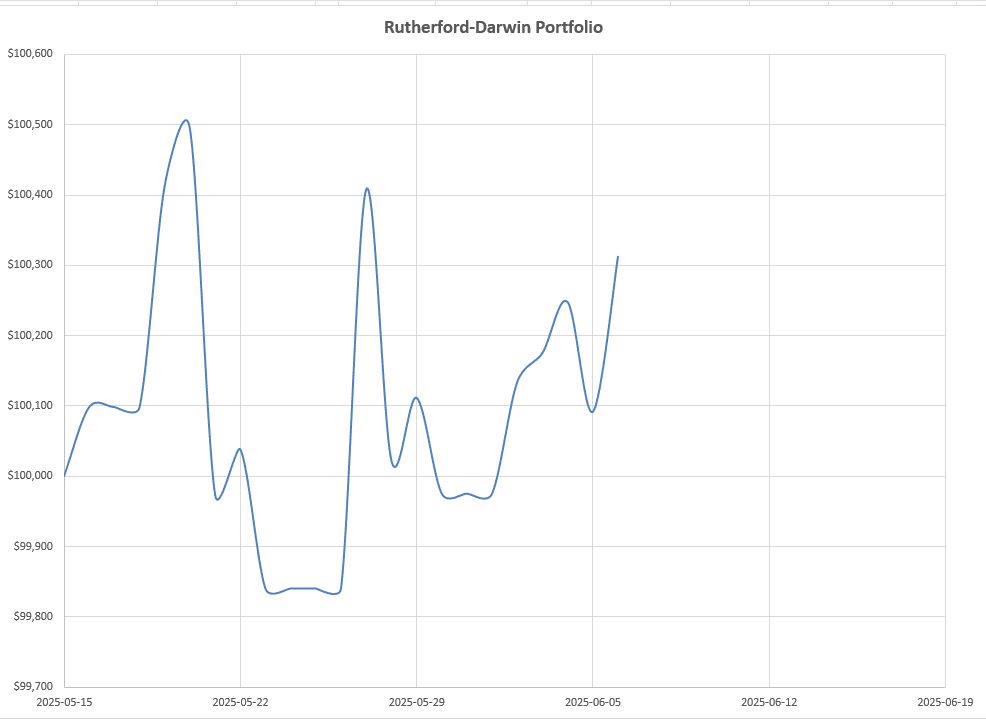
Again, it’s early days (only 3 weeks of data) but, although the above graph looks noisy, the scale is very narrow at this point and the portfolio is showing an amazingly low 3.43% volatility and trading in a ~$700 range. My target is to keep volatility below 12%, so we are well within that target so far – but this will change.
The total portfolio is showing ~$300 in (unrealized) profits.
Discover more from ITA Wealth Management
Subscribe to get the latest posts sent to your email.
EEM and EFA go ex-Dividend on Monday and the Option Calls that I sold are In-The-Money (ITM) – that means I would likely have shares taken from me as people owning the Options would probably exercise their option to collect the dividend. By buying back the Calls I will not have to give up my shares and will collect the dividends.
Also, I am underallocated in EEM so I have bought another 225 shares to bring my total holdings to 500. I will pick up the dividends on 500 shares when they go ex-Dividend on Monday and will be able to sell 5 Call Options to generate additional income or to finance the purchase of more defensive Put Options.
I will provide more details in my week-end update.
David