
Partial Roman Remains of Hadrian’s Wall, North of England, UK
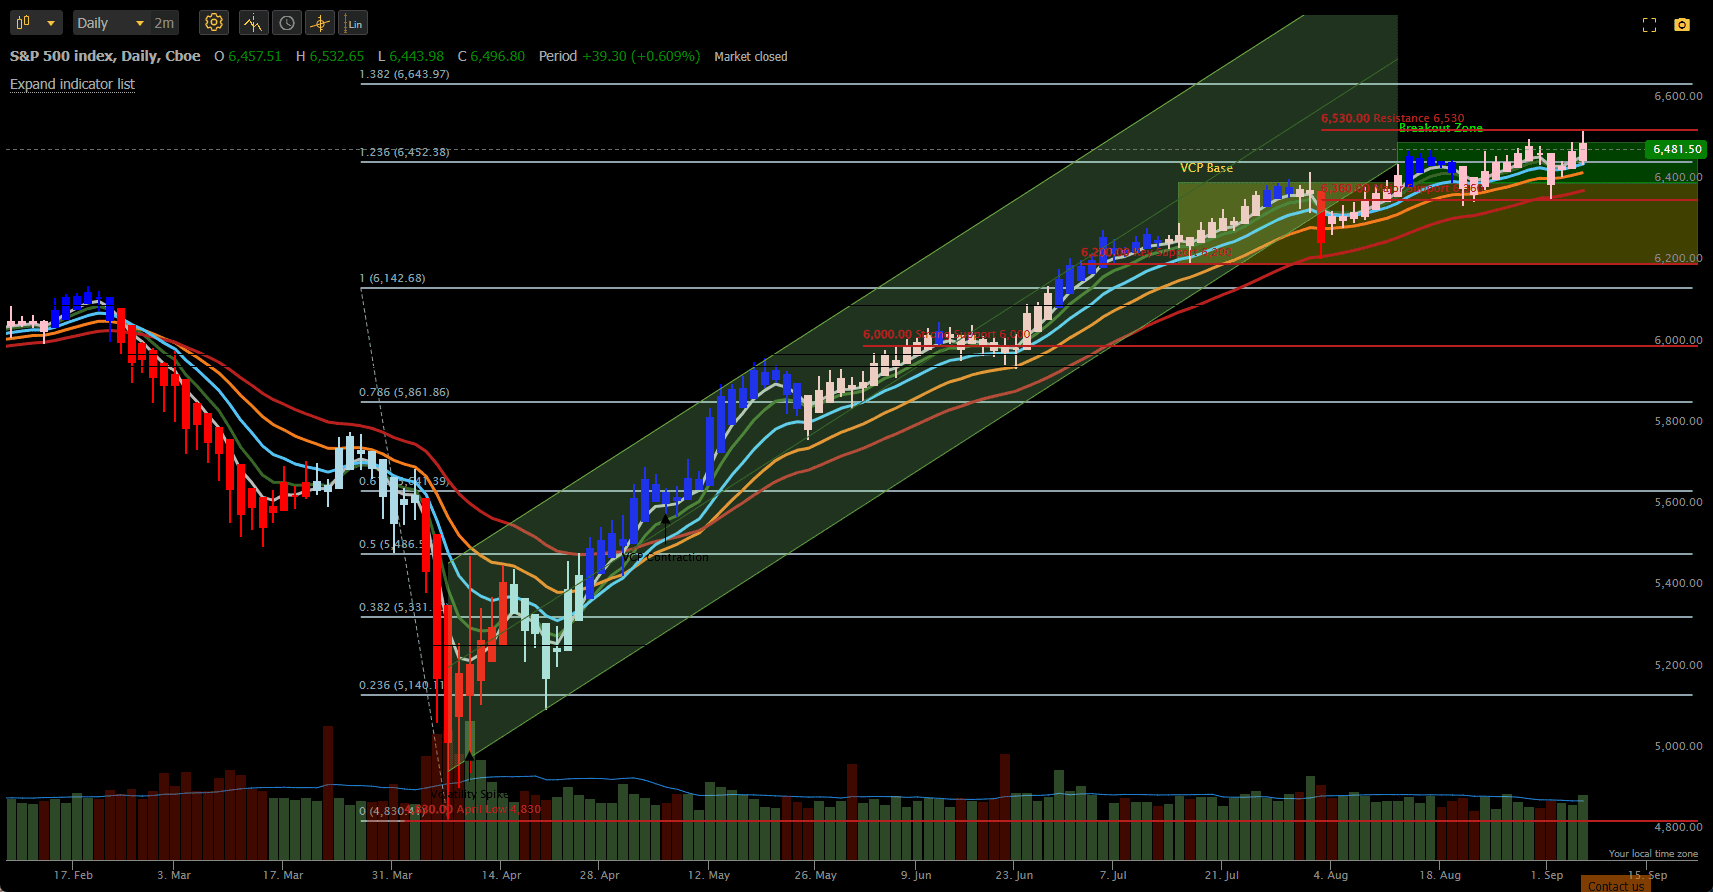
After a shaky start on Tuesday, after the Labor Day weekend, US equities rallied for the remainder of the week to close up ~0.3% from last week’s close and at new all-time highs:
However, this did not place US equities near the top of the best performing asset classes:
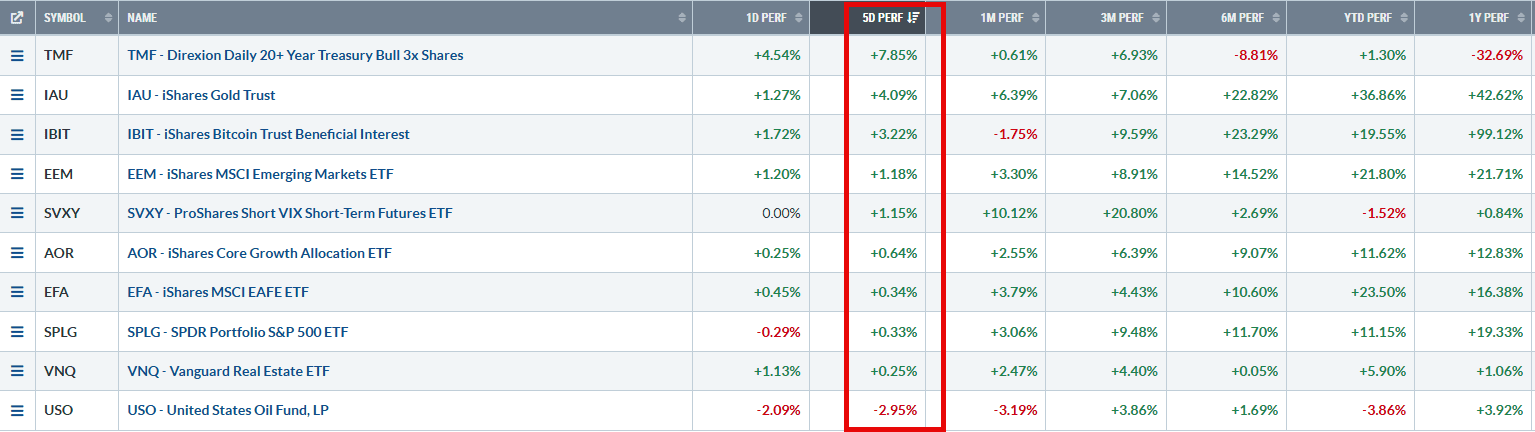 with defensive assets (Bonds and Gold) leading the way.
I did not make any adjustments to the portfolio this week as I am still working on an updated algorithm/modification to the Kipling BHS model. The current BHS model shows the following rankings and recommendations:
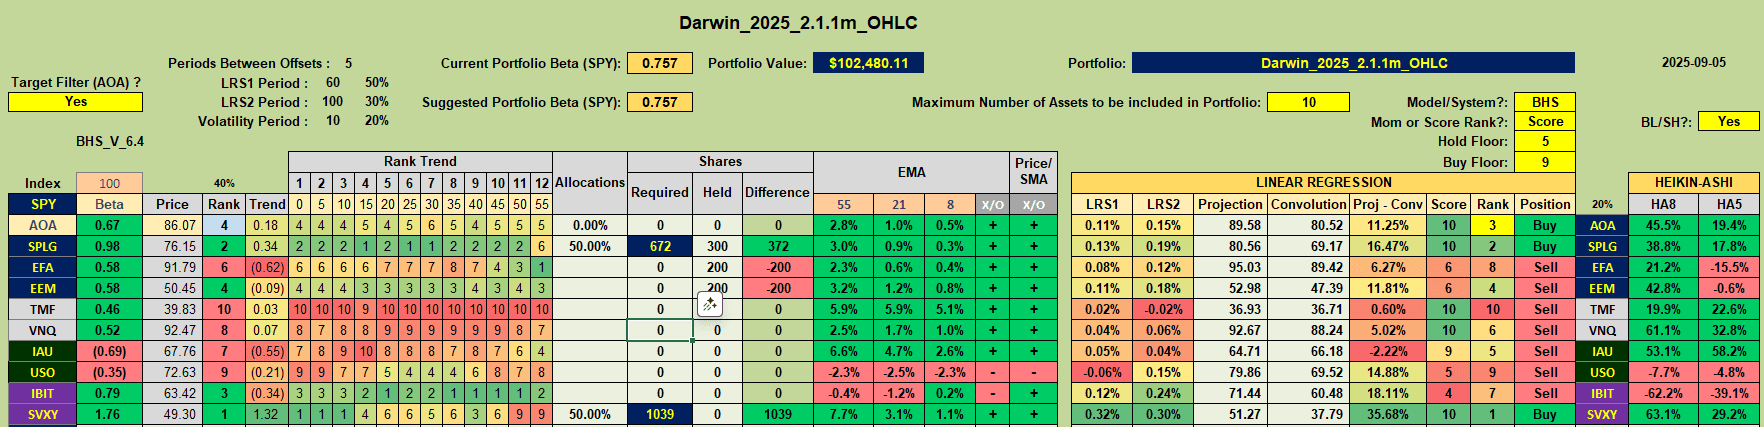
Based on this I would hold on to SPLG, sell current holdings in EFA and EEM and possibly buy shares in the benchmark AOA Fund. This ignores the recommendation to open a position in SVXY (that I should have done many weeks ago when the signal triggered) since I still think we are due for a pullback and a consequential increase in Volatility (that would not favor a long position in SVXY).
To date, performance of the portfolio looks like this:
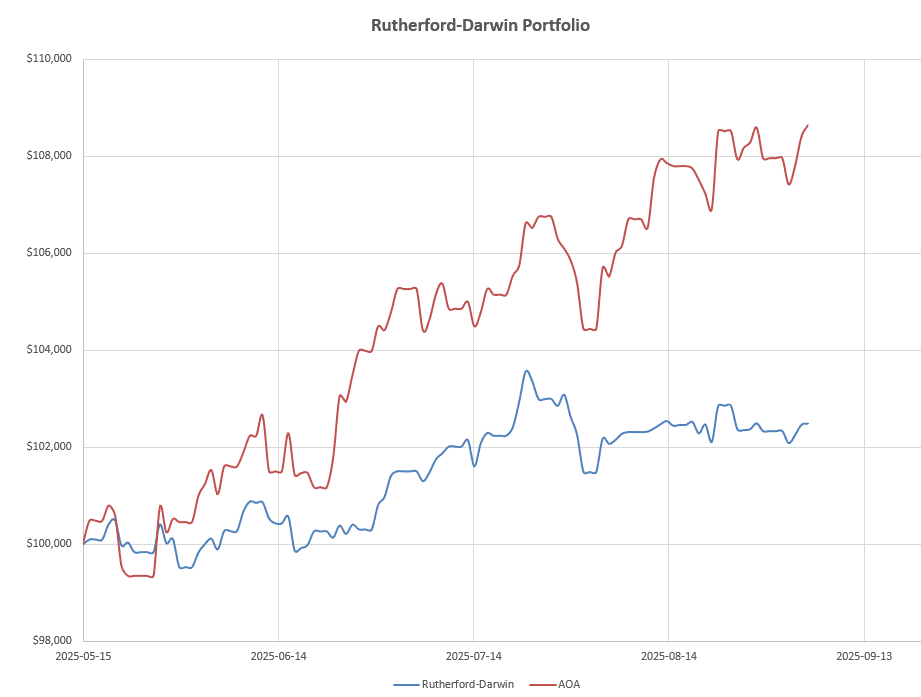 that shows low volatility (risk) at 4.65% – as planned – at the expense of returns. As mentioned last week, the lower returns are due primarily to the fact that only ~50% of available funds have been invested in the portfolio. I am therefore looking at the best way to increase this investment level without significantly increasing volatility/risk. At present, the 3 ETFs held in the portfolio (SPLG, EFA and EEM) are hedged through the sale of Call Options.
A quick look at my modified rotation model shows the following recommendations:
 with (ignoring SVXY for now) Buy recommendations for EEM (Emerging Markets) and IAU (Gold) and a Hold recommendation for EFA (Developed markets). SPLG gets a Sell recommendation since it is presently not looking quite as strong as the benchmark AOA Fund – although it’s very close.
The new algorithm retains the essential characteristics of a Dual Momentum (DM) model, taking absolute and relative momentum into account but adds Exponential Moving Average (EMA) crossovers into the equation as a measure of Trend. MACD and RSI values (both momentum indicators) are also included in the spreadsheet and all inputs are normalized to their relative strengths over the past 100 days (adjustable if desired). Normalized values are ranked by indicator/signal type and combined/weighted to generate a “Score” and portfolio “Rank” for each asset. For a rotation model I am looking for assets performing better than the benchmark. I have arbitrarily chosen a maximum of 4 assets (with Buy recommendations) to hold in the portfolio – although Hold recommendations may increase this maximum holding number. I have kept the HA numbers in the spreadsheet but these are not included in the Buy/Sell/Hold algorithm (at least not at this point).
The MACD and RSI Indicators are also used to indicate when it might be time to include an Option hedge position – but this is still a work in progress to decide which Options might be best to use. However, my intention is to increase the calculated share holdings for a given targeted volatility level (by ~50%) that would allow me to sell Options with more time premium whilst still keeping volatility at acceptable levels. I would like to do some back-testing on this system, but that is difficult and time consuming, so I will proceed with forward testing and adjust going forward as might be necessary. From my previous experience with these trend/momentum models I am pretty confident that this won’t get out of hand – even if performance is not quite as good as I might like. We can only take what the market will give us.
As an example, the recommendation to Buy IAU (Gold) triggered on 28 February (white vertical line in figure below):
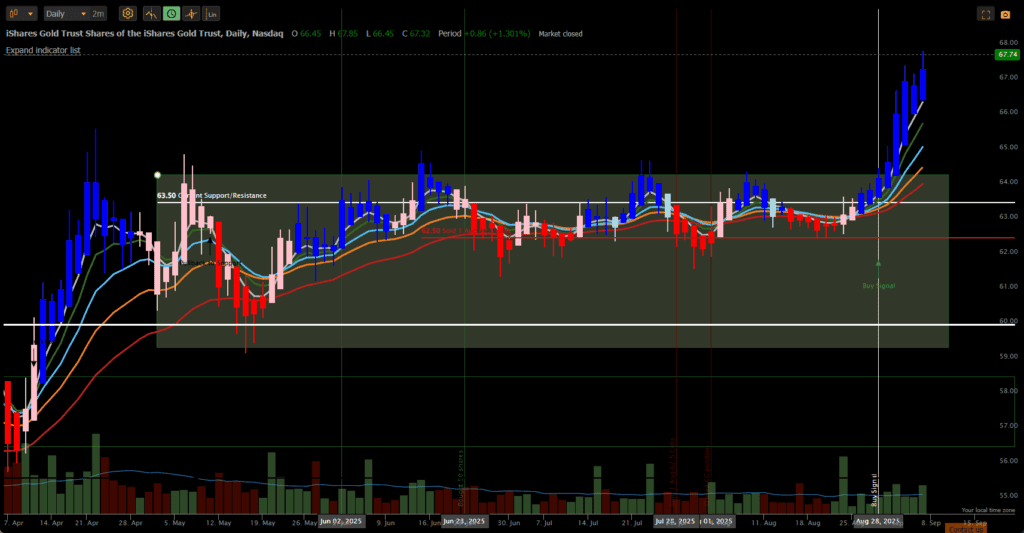 Obviously, this may be a fortuitous example but this would have been a great entry point for this ETF.
I am probably a little late to the IAU party but we have to jump in somewhere so, assuming we see continuing strength, I might still jump onboard here. I am presently still holding EFA and EEM (both hedged) so I will keep those ETFs. SPLG could “flip” at any time but, unless it shows strength next week, I will sell that ETF.
I will update this post if/when I make the adjustments.
Update: 8 September 11:00
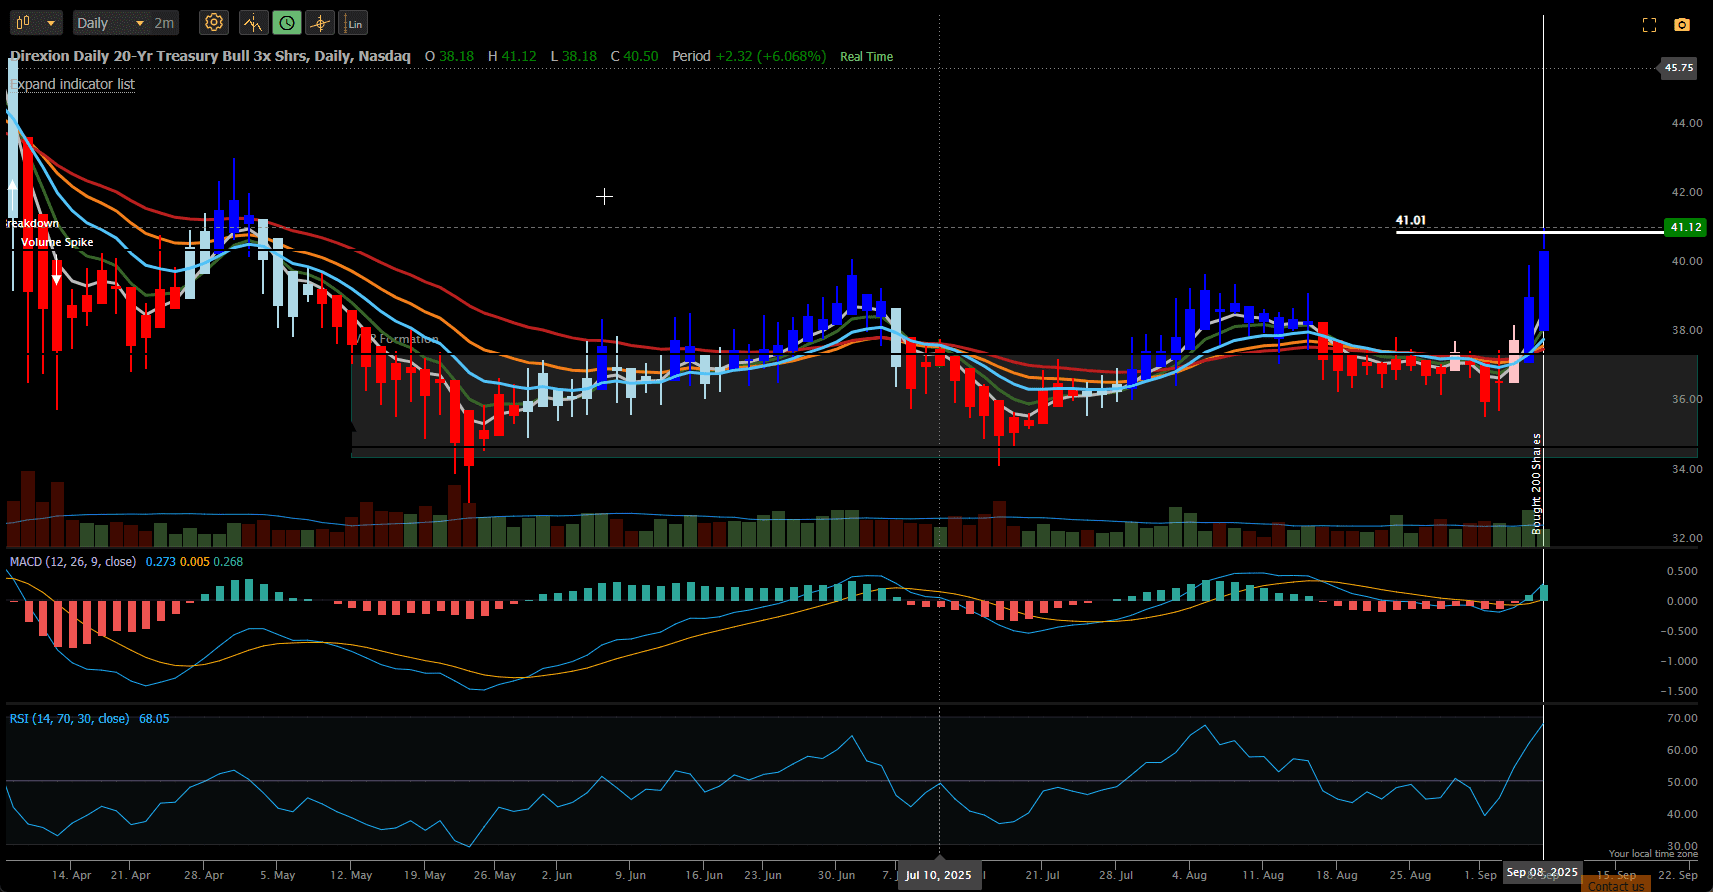
Gold opened higher again this morning so I decided to migrate towards the new algorithm and to buy 200 shares in IAU:
 At the same time, Bonds (TMF) also signalled a recommended Buy, so I bought 200 shares of TMF. If we get a cut in interest rates this makes sense – although I would have thought that most of this would already be baked in. TMF is a leveraged Bond fund that can show mediocre performance at best when bonds are going nowhere over a long period of time but can show nice geometric growth in a strongly bullish move – we’ll wait and see what happens from here.
 Although US equities are not looking particularly weak, and are still hitting new all-time highs, the algorithm is suggesting that they are losing momentum, so, again, I have followed the recommendations of the model and have sold my hedged positions in SPLG i.e. I sold the 300 shares being held and bought back the 2 Option contracts that were hedging the position (retaining a profit from the sale of the calls). The value of the shares bought and sold just about balanced each other so I am still only ~50% invested. The calculated number of shares to be held to meet a 2% volatility target was ~140 for both IAU and TMF – so I have oversubscribed by ~50% to these 2 ETFs or, alternatively, increased the potential volatility level to ~3%. I will explain the reason for this if/when it becomes time to consider hedging.
Discover more from ITA Wealth Management
Subscribe to get the latest posts sent to your email.
The above post has been updated to reflect adjustments made on Monday morning (8 Sept) .