
Botanic Gardens, Singapore
Last week I started to populate the Dirac Portfolio so as to manage it using my new Momentum/Trend and integrated Mean Reversion model/system. The objective is to see if it might be possible to beat the broader US Equity Market (S&P 500 or similar Index/Fund) by rotating between sectors that comprise this broader market.
I started to populate the portfolio by purchasing shares in four of the ten Sector ETFs (XLB, XLE, XLF and XLV) within this market that were generating momentum Buy signals at the time I started (5 January):
 I chose not to buy shares in XLU (Utilities) that was showing a Mean Reversion Buy signal at that time.
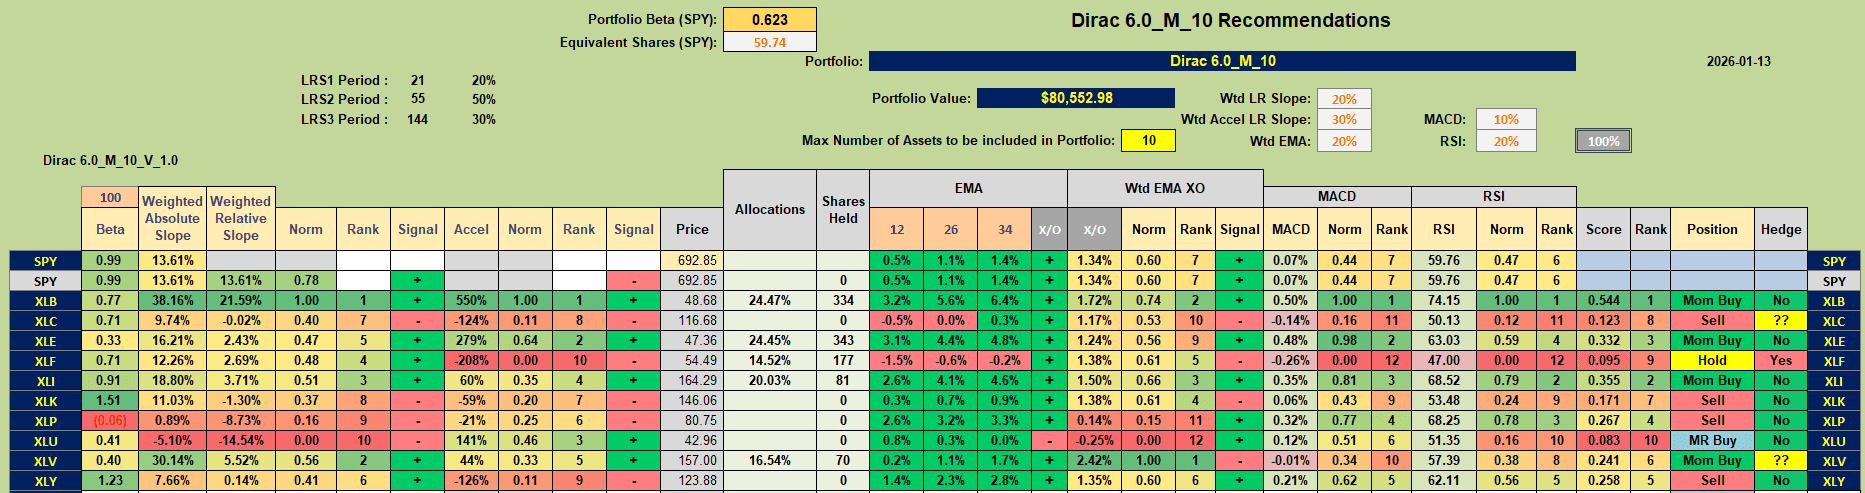
On 13 January the Mom Buy signal on XLF (Financials) changed to a Hold signal as acceleration turned negative – but, no need to adjust until the weakness was confirmed by the momentum also turning negative.
As XLF switched from a Buy to a Hold position on 13 Jan, XLI also changed from a Sell to a Momentum Buy:
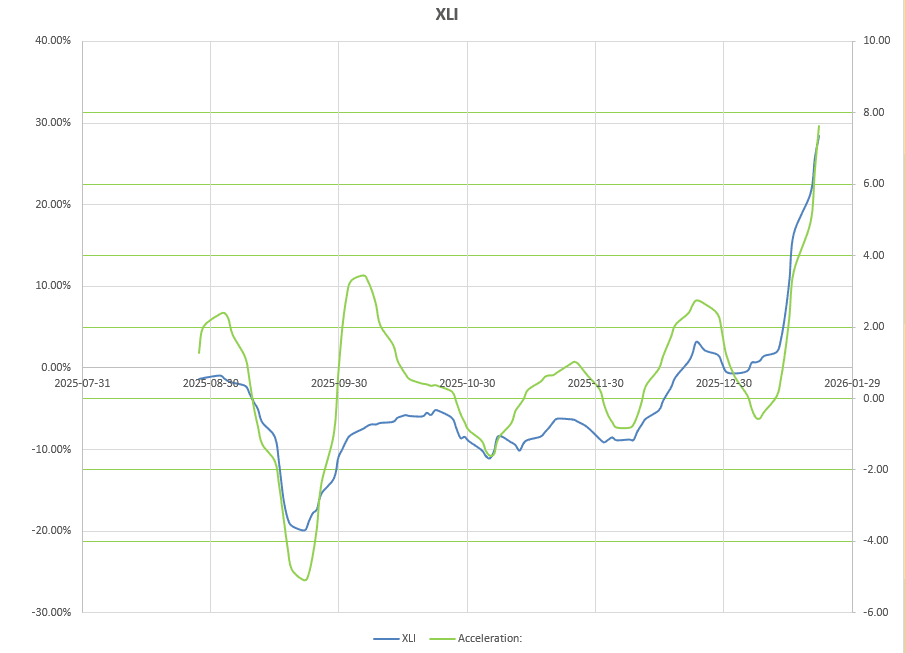
and 81 shares were purchased to to add to the portfolio.
On 15 Jan the weakness in XLF was confirmed as momentum (blue line) fell into negative territory:
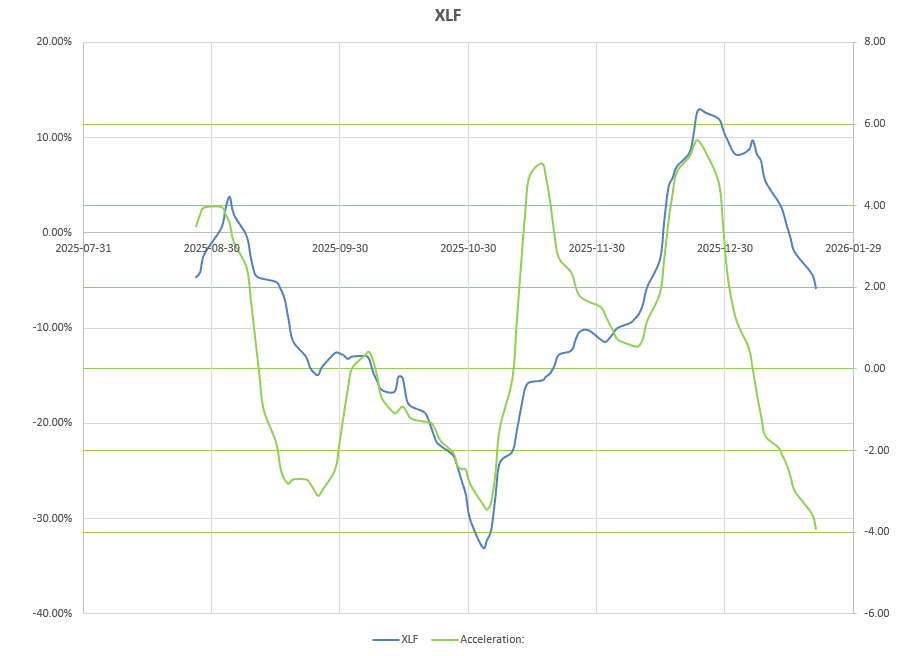 and has continued to weaken along with strong deceleration (downward movement of green line). Shares were sold resulting in a ~$340 loss.
Since then the analysis has changed to look like this on 21 January:
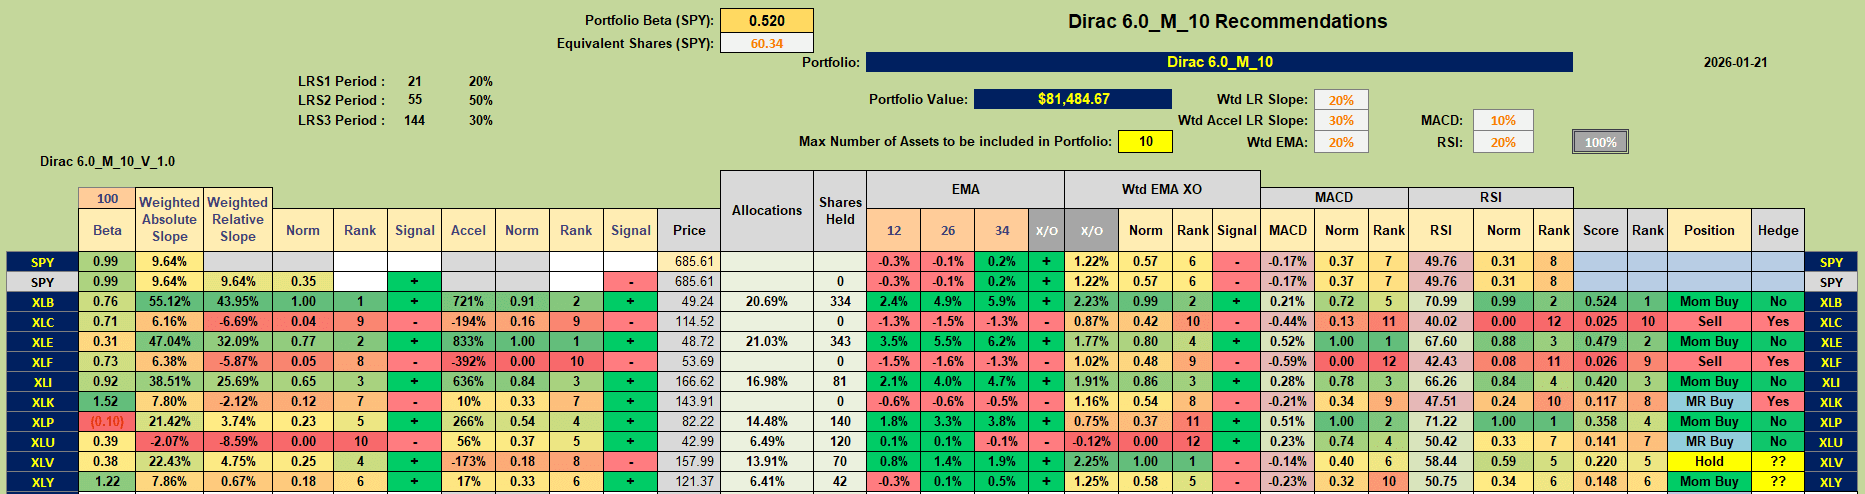 The signal on XLF is confirmed as a Sell and MRU remains a potential Mean-Reversal Buy. In addition, Momentum Buy signals are generated for XLP (Consumer Staples) and XLY (Consumer Discretionary) and a Mean Reversal Buy Signal on XLK (Technology). XLV has switched to a Hold.
Let’s take a look at the graphs behind some of these signal recommendations:
First, the Mean Reversal Buy signal for XLU that has been showing for some time:
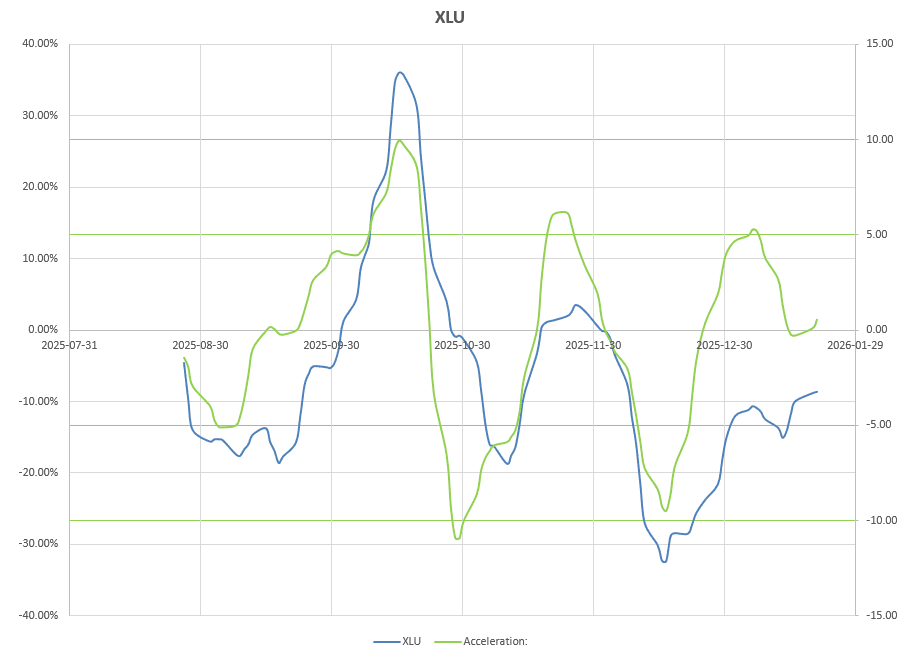
where both momentum (blue) and acceleration (green) are in upward movements but with momentum (blue) still in negative territory (below the zero left-side horizontal axis) and acceleration reversing weakly upwards at the zero right-side horizontal axis. If we buy here and acceleration reverses below the zero horizontal axis we would need to be prepared to sell (probably with a small loss). If however, acceleration continues, positive momentum will also continue it’s upward trend and convert to a Momentum Buy signal if this line were also to cross above the zero horizontal line and we might be in a nice Buy Low/Sell High scenario.
Checking the other Buy Signals:
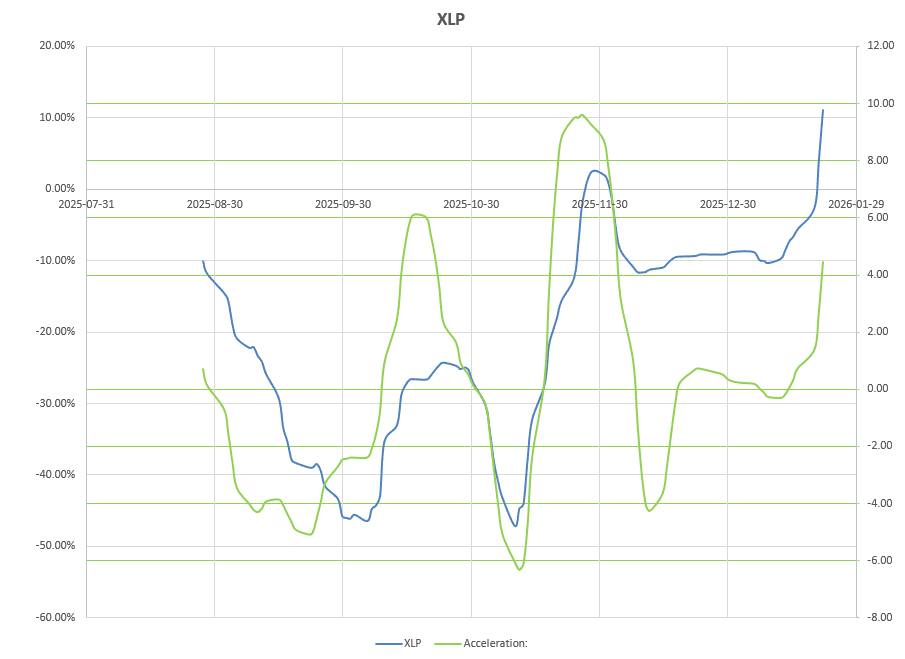 XLP is showing strong upward movement in both momentum and acceleration, while XLY:
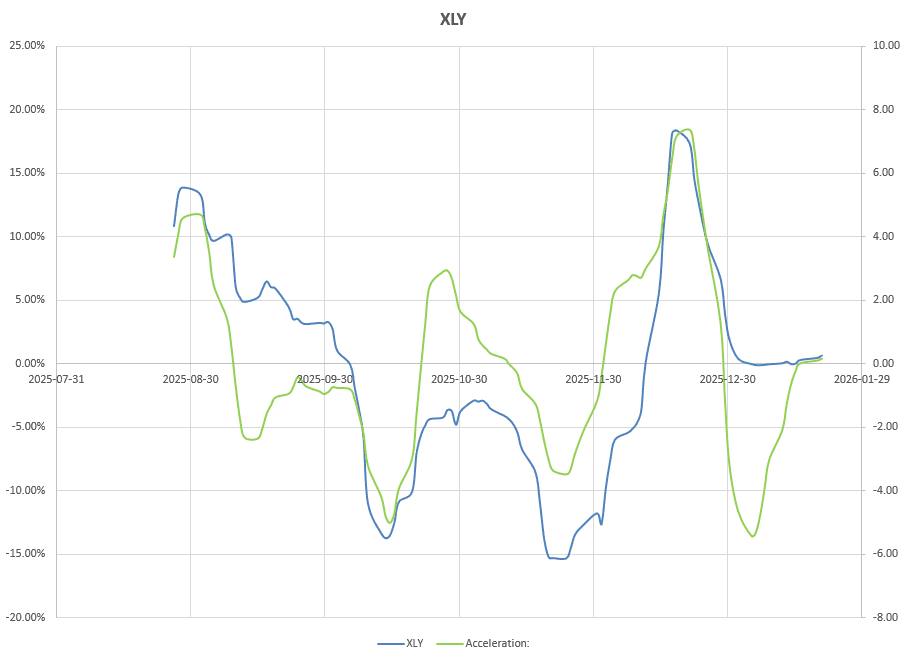 is only slightly positive for both momentum and acceleration (Momentum Buy) with both blue and green lines moving slowly at the zero axis line – not super encouraging even though we do have a Buy signal.
XLK is showing a Mean Reversion Buy signal (negative momentum) – again with momentum and acceleration drifting sideways along their respective zero axes:
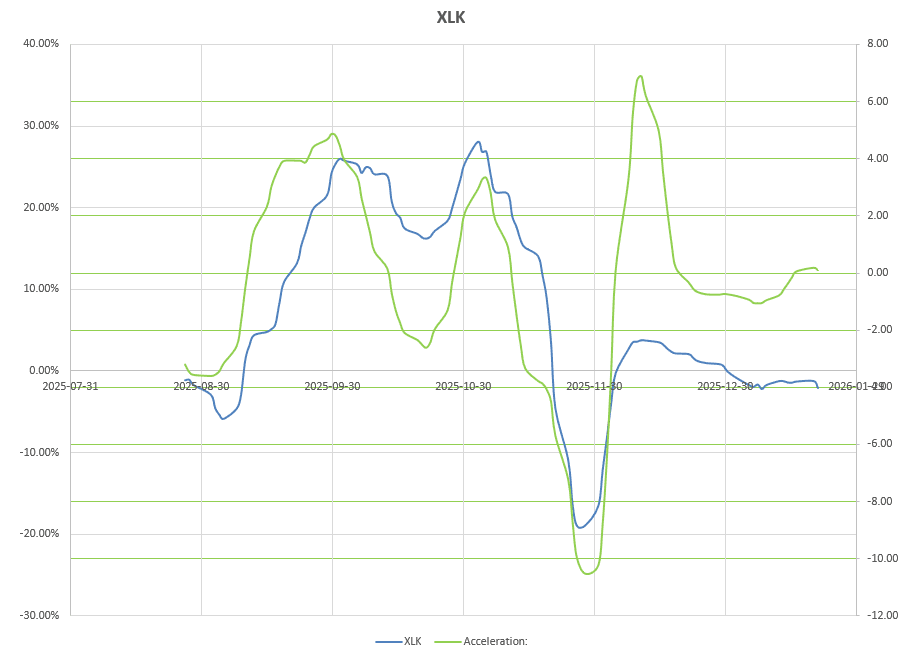 Both XLY and XLK could move quickly in either direction to generate either stronger Buy or Sell signals.
Based on the above recommendations and graphs I decided to act on the Momentum Buy Signal for XLP and to allocate the full equal weight funds to that ETF. Of the others XLK seems the most questionable – so I will just watch that for now, and I’ll split another full allocation between XLU and XLY (50% each) so that my trade sheet looks like this:
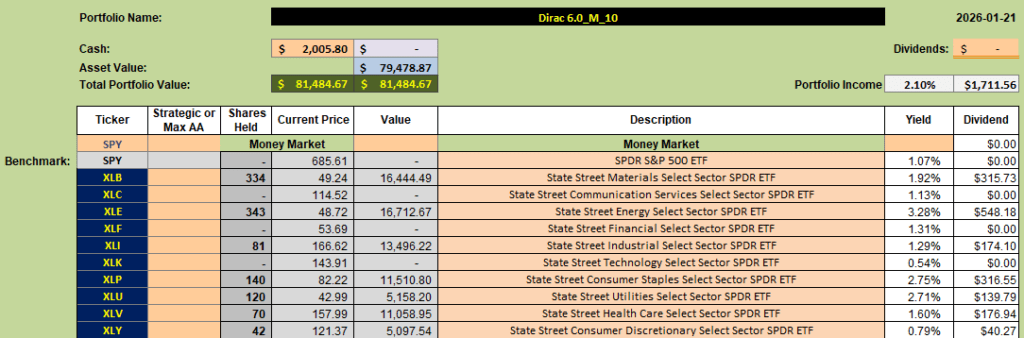
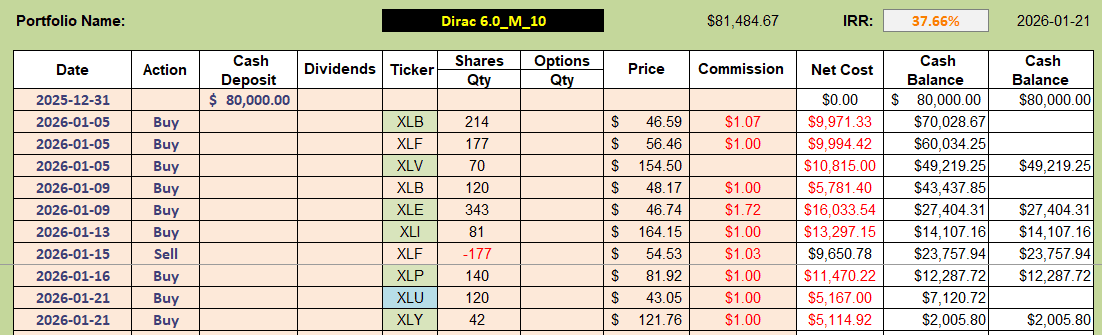 and the allocation table like this:
 At some point I will have major adjustments to get this into full equal weighting. XLB, XLE and XLI are presently overweighted with XLU and XLY underweighted as described above. Although the weighting isn’t at target weights at least the portfolio is close to 100% fully invested – so it is at least close to that objective.
 Performance to date looks like this:
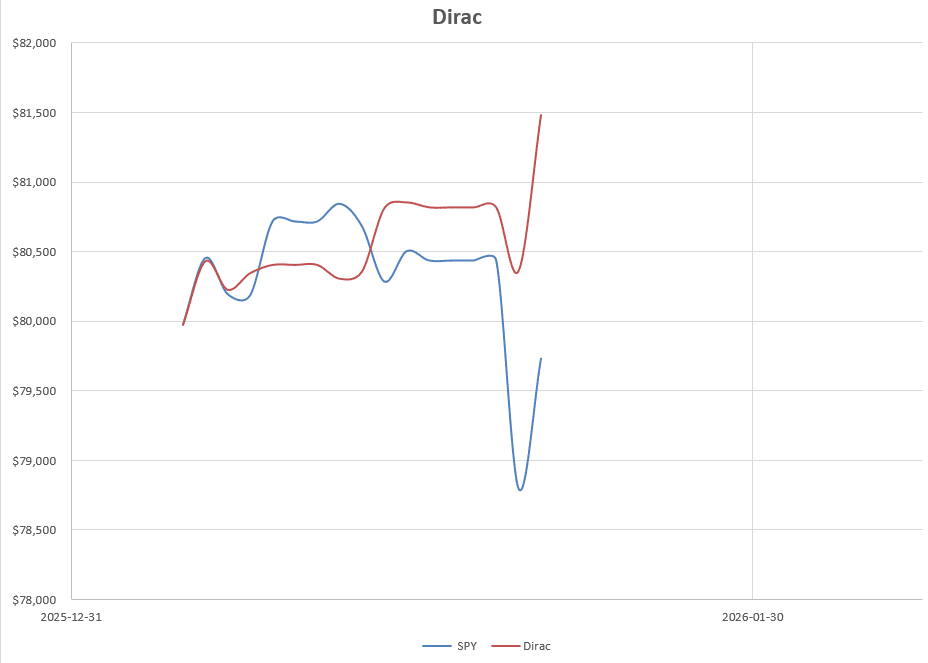 which is encouraging.
Discover more from ITA Wealth Management
Subscribe to get the latest posts sent to your email.
Leave a Comment or Question