Retired Diesel Engines
Copernicus is a portfolio designed to keep pace with the S&P 500. The goal of this portfolio is to use dollar-cost-averaging by purchasing U.S. Equities during good and bad times while never selling unless there is no other choice. Thus far, this investing model is working extremely well as the Copernicus is the top portfolio performer.
As mentioned before, the Copernicus is a portfolio example for the young investor who can save a few dollars each month and when there is sufficient cash, purchase shares on SPY or a similar ETF. Keep this up year in and year out and you will have a nice retirement fund waiting when you will need it. Another recommendation is to save using a Roth IRA is you are using dollars that have already been taxed.
Copernicus Security Recommendations
Four U.S. Equity ETFs are used and as readers can see below, all are listed either as a Hold or Hold?. The number one rank goes to VTI so I have a limit order in to purchase more shares of VTI.

Copernicus Performance Data
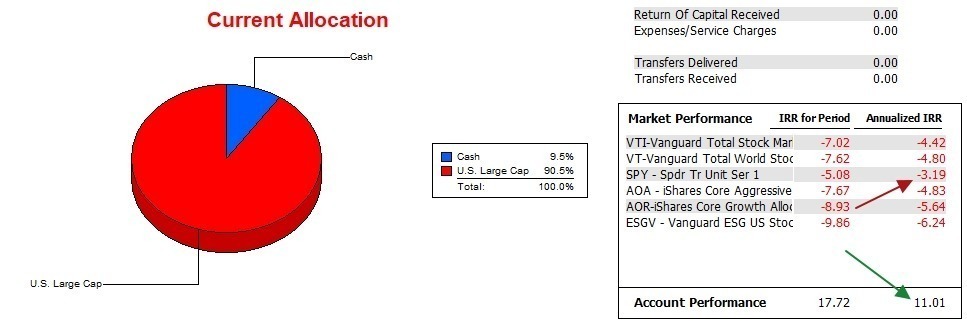
Since 12/31/2021 the Copernicus is returning 11.0% annualized while the SPY benchmark is a negative 3.2%. Checking the IRR for the Period, the separation is over 20%. How can this be since the investments are a mirror of the S&P 500? As readers will recall, 2022 was a poor year for equities. New money came into the Copernicus and shares were purchased at low prices. Those shares are now making a big difference in the Internal Rate of Return (IRR). Dollar-cost-averaging is working to the advantage of the holder of the Copernicus.

Copernicus Risk Ratios
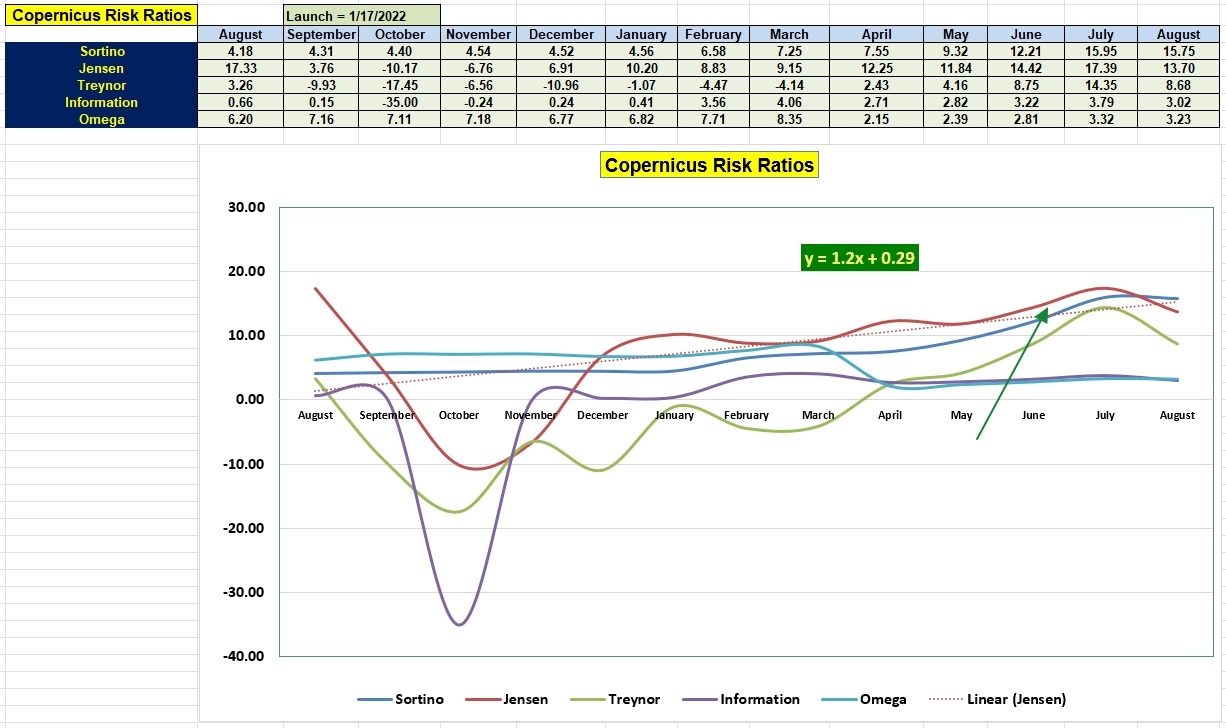
August has cooled the hot Copernicus portfolio. Even so, the Jensen Alpha remains a very high 13.7. We did not expect the portfolio to sustain the July level of 17.

Copernicus Buy & Hold Portfolio Review: 18 May 2023
Copernicus Portfolio Review: 11 August 2022
Discover more from ITA Wealth Management
Subscribe to get the latest posts sent to your email.
You must be logged in to post a comment.