John Day Area of Oregon
Millikan is another Sector BPI Plus portfolio that is meeting expectations. If you are a new reader, check past blog posts on the Sector BPI investing model or keep reading the Sector BPI portfolio reviews that show up nearly every week. We use Bullish Percent Indicators (BPI) data for our sector ETF recommendations. Otherwise, we revert to recommendations that come out of the Kipling spreadsheet for our equity and bond recommendations.
Millikan Investment Quiver and Holdings
The sector ETFs are those with the gray background. I prefer using Vanguard ETFs for these sectors. iShares also have sector ETFs and some investors may prefer to use them.
The Strategic or Max AA percentages for the sector ETFs is based on their three-year volatility percentages. The percentages from VCR down through VNQ will add up to close to 100%. Percentages associated with the other ETFs are my personal maximum percentages. From time to time I will exceed these maximum percentages.
Note that the maximum percentage for VOX is 10.3% while the current holding is 30.4%. This radical difference is due to two factors. 1) VOX was purchased before I implemented the “volatility” asset allocation calculation. 2) VOX has increased in value since it was purchased many months ago.

Millikan Security Recommendations
Employing the Buy-Hold-Sell model and the “default” look-back combination, the four U.S. Equity (SPY, ESGV, VTI and VOO) are all Hold recommendations. Of the sector ETFs, only Utilities (VPU) is a Buy based on BPI data and we already hold the recommended percentage.
Little needs to be done with the Millikan.

Millikan Manual Risk Adjustments
As you can see from the Shares Required (5th column from the right) no changes are planned. I did set several limit orders to purchase VOO, SPY, and ESGV well below their current prices should the market dip suddenly. The prices were set low enough that I don’t expect them to be struck, but there they are should we experience a sudden market decline.
I have a standing sell order to purge 200 shares of GLQ from the Millikan.

Millikan Performance Data
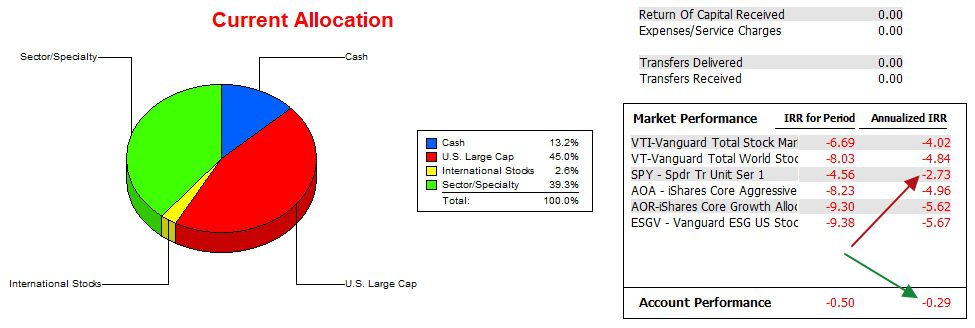
Since 12/31/2021 the Millikan managed to outperform SPY or the S&P 500 by a small margin. One goal is to maintain this lead.

Millikan Risk Ratios
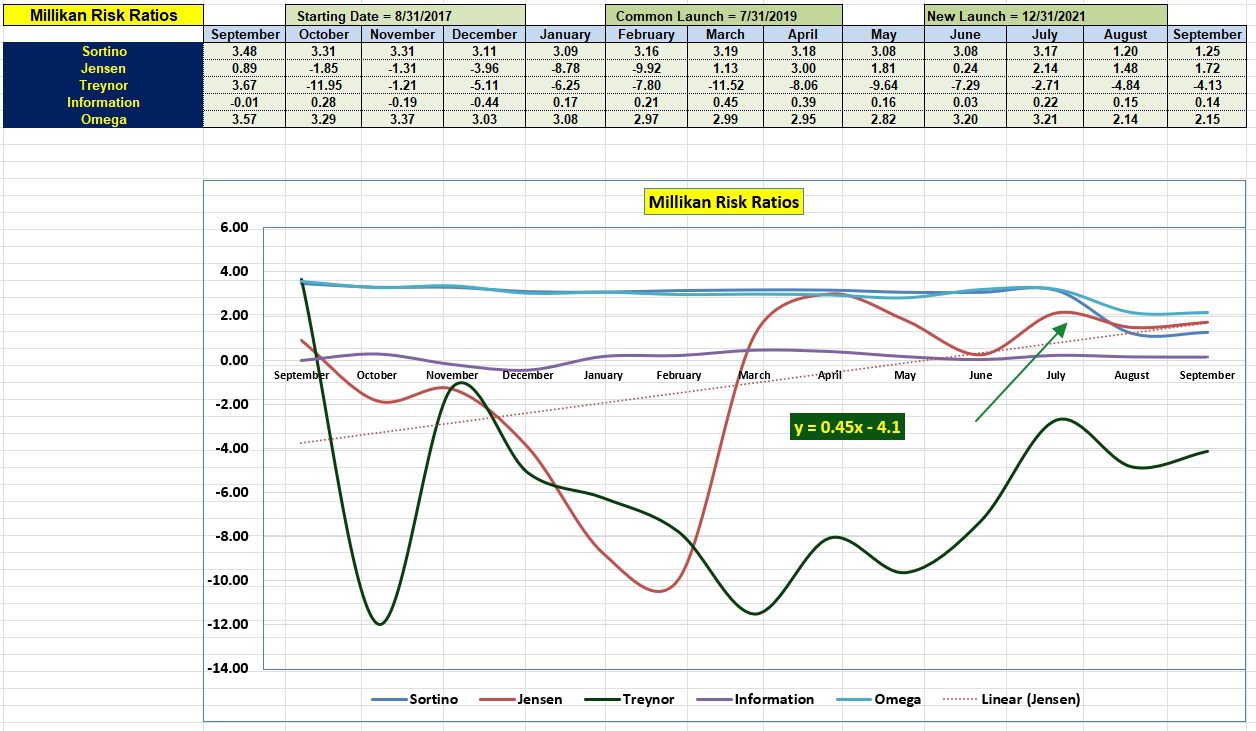
Based on the Information Ratio the Millikan lost a bit of ground to SPY over the past few days. On the plus side the Jensen improved. Of the five risk factors, I pay most attention to the Jensen Performance Index as it tells one how the portfolio is performing based on the underlying risk of the portfolio. Here is a more complete definition of the Jensen.
“The Jensen’s measure, or Jensen’s alpha, is a risk-adjusted performance measure that represents the average return on a portfolio or investment, above or below that predicted by the capital asset pricing model (CAPM), given the portfolio’s or investment’s beta and the average market return. This metric is also commonly referred to as simply alpha.”

Millikan Sector BPI Update: 20 July 2023
Discover more from ITA Wealth Management
Subscribe to get the latest posts sent to your email.
Lowell,
My SS still is not returning descriptions and yields. Is there a fix available yet?
Bob W.
Bob,
Yes, there is a fix. I’ll send you the ITA file that is working for me. I assume you have clicked on the Fix Links option.
Lowell
Lowell,
How long have you been able to get yields and security names since the “fix”? Can I also get a copy of your most recent ITA file. As with Bob P, Fix Links doesn’t change anything.
~jim
Lowell
My SSs are also not providing Yields etc. And I did click on the Fix Links.
You did send me an ITA file a few months ago and it did work for a while.
Can you send me another ITA ?
Thanks
Bob Petersen
Bob and Jim,
The file should be in your mailbox. Let me know if all works.
Lowell
Lowell,
Downloaded and tested. First time that I’ve had descriptions and yields in months. Thanks for the file.
~jim
Jim,
Good to know all is working again.
Lowell