
Botanic Gardens, Singapore
Despite the negative reaction and high volatility following Wednesday’s Fed announcements the SPX (S&P 500 Equity Index) managed to close the week a little over 1% higher from last week’s close:
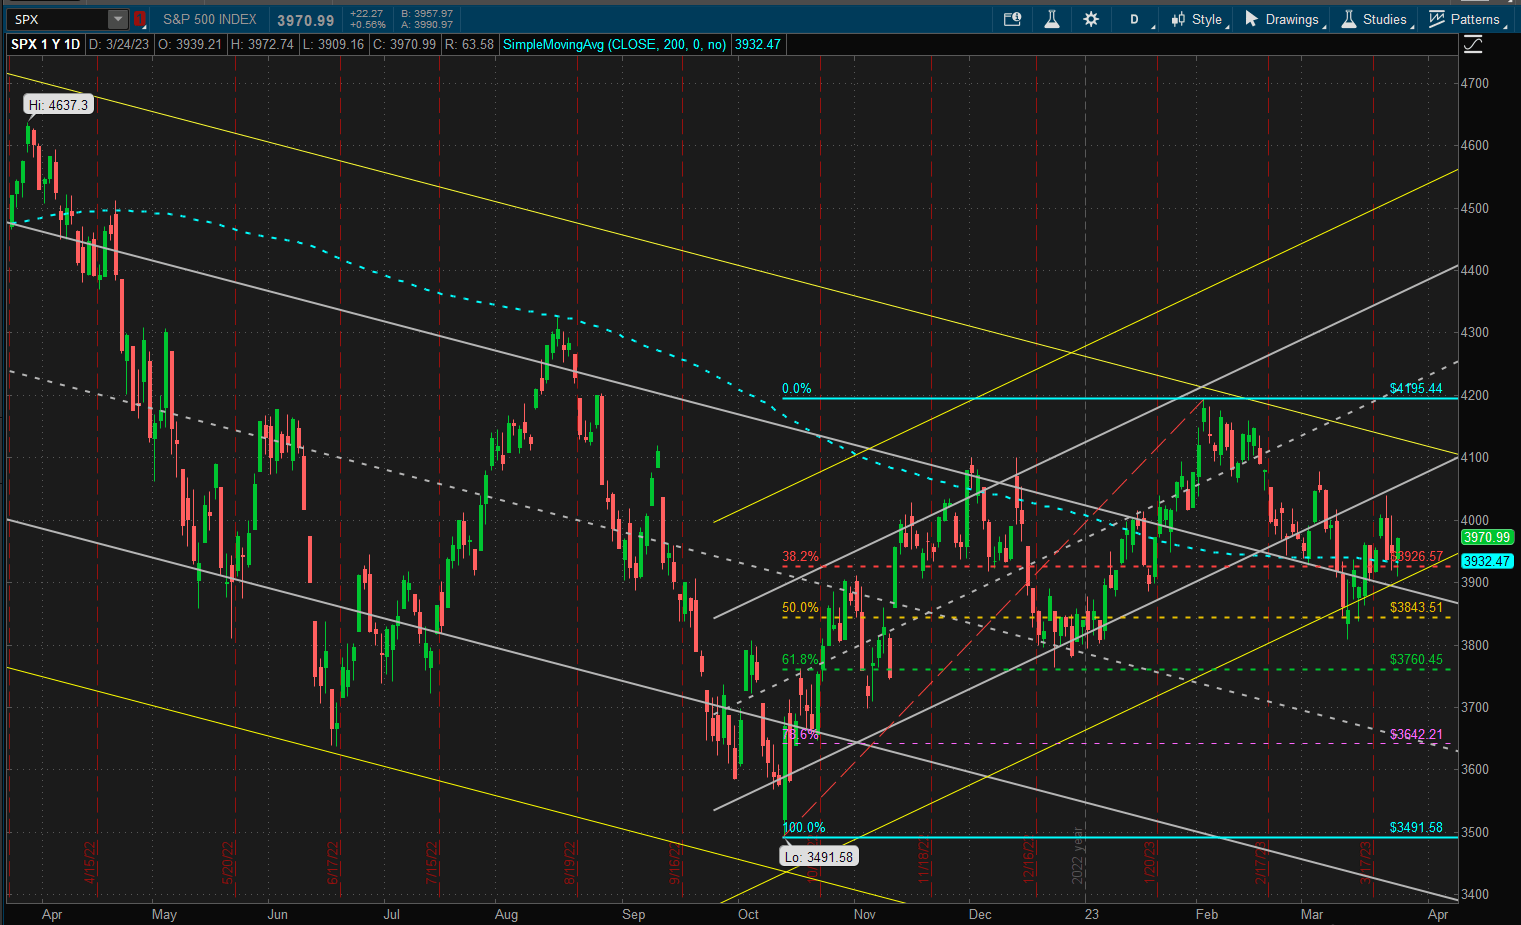 However price is still sitting at the top of a 2 SD long term downtrend channel and the bottom of a shorter term bullish uptrend channel. For investors/traders looking for “patterns” these two boundaries are forming a “pendant” pattern from which we will eventually breakout either to the upside or to the downside. In the meantime we are sitting in the middle of a sideways channel centred at the support/resistance zone as defined by the 200-day Simple Moving Average (SMA) and the 38.2% retracement from the Feb high (at ~3935).
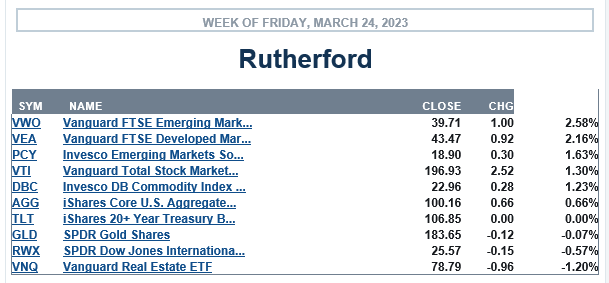
In terms of relative performance US equities came in close to the centre of the pack, falling behind International equities (Developed and Emerging Markets) but ahead of Real Estate, Commodities and US Bonds:
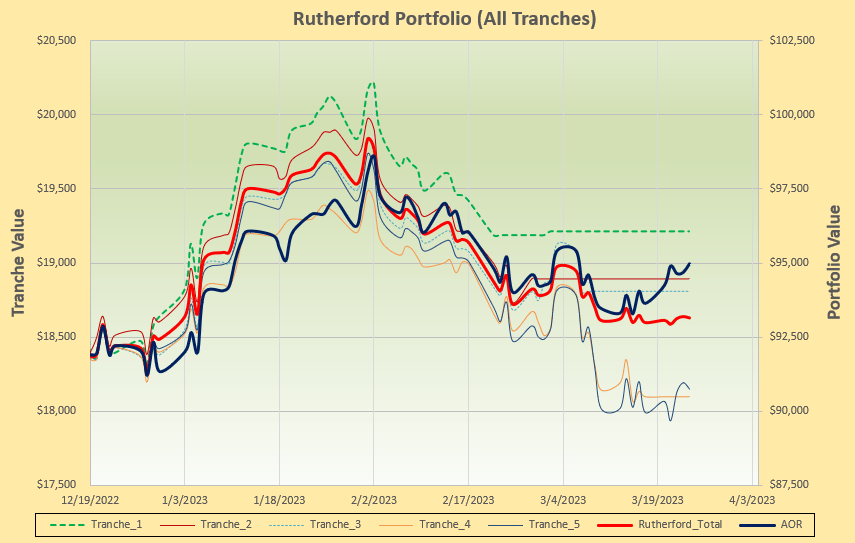
 The Rutherford portfolio is presently holding ~80% in Cash and 100% in Tranche 1 (the focus of this week’s review):
 and performance suffered over the past week as a result of last week’s recommendations to move to defensive positions in bonds and commodities:
 We’ll take a look at the rotation graphs:
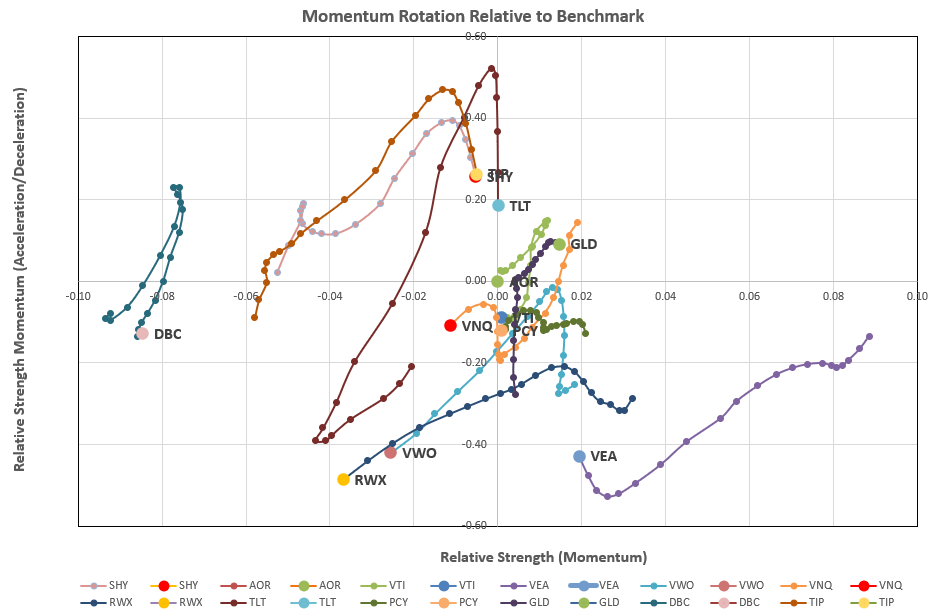 where we don’t see a lot of action in the preferred top right quadrant – apart from, maybe, Gold (GLD) – so let’s take a look at this week’s recommendation:
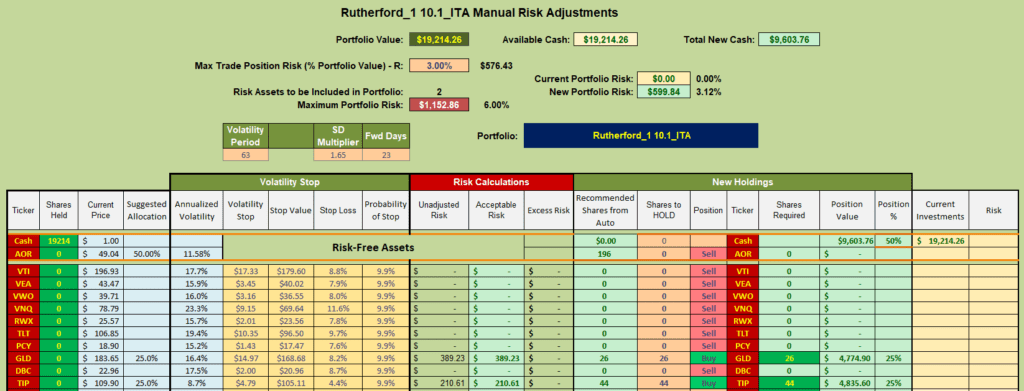
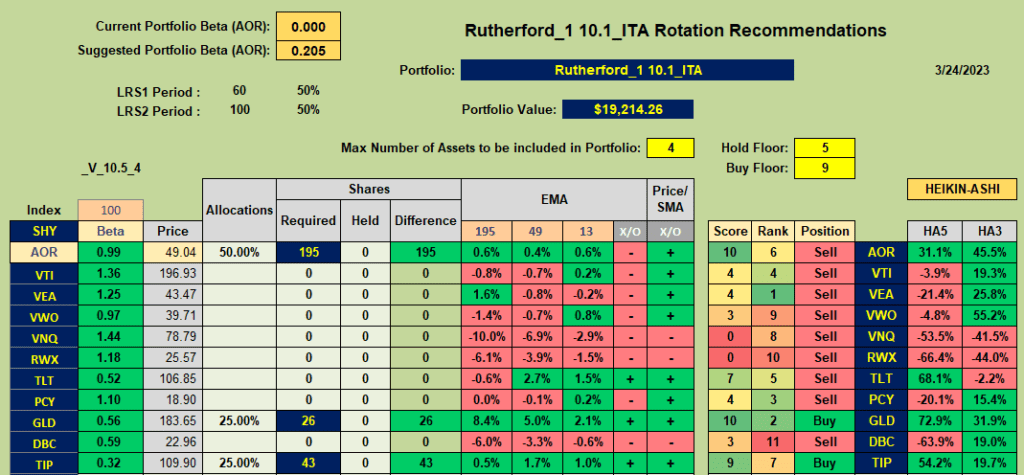 that suggests adding to positions in GLD and TIP with the balance (~50% available funds) remaining in Cash:
Discover more from ITA Wealth Management
Subscribe to get the latest posts sent to your email.
You must be logged in to post a comment.