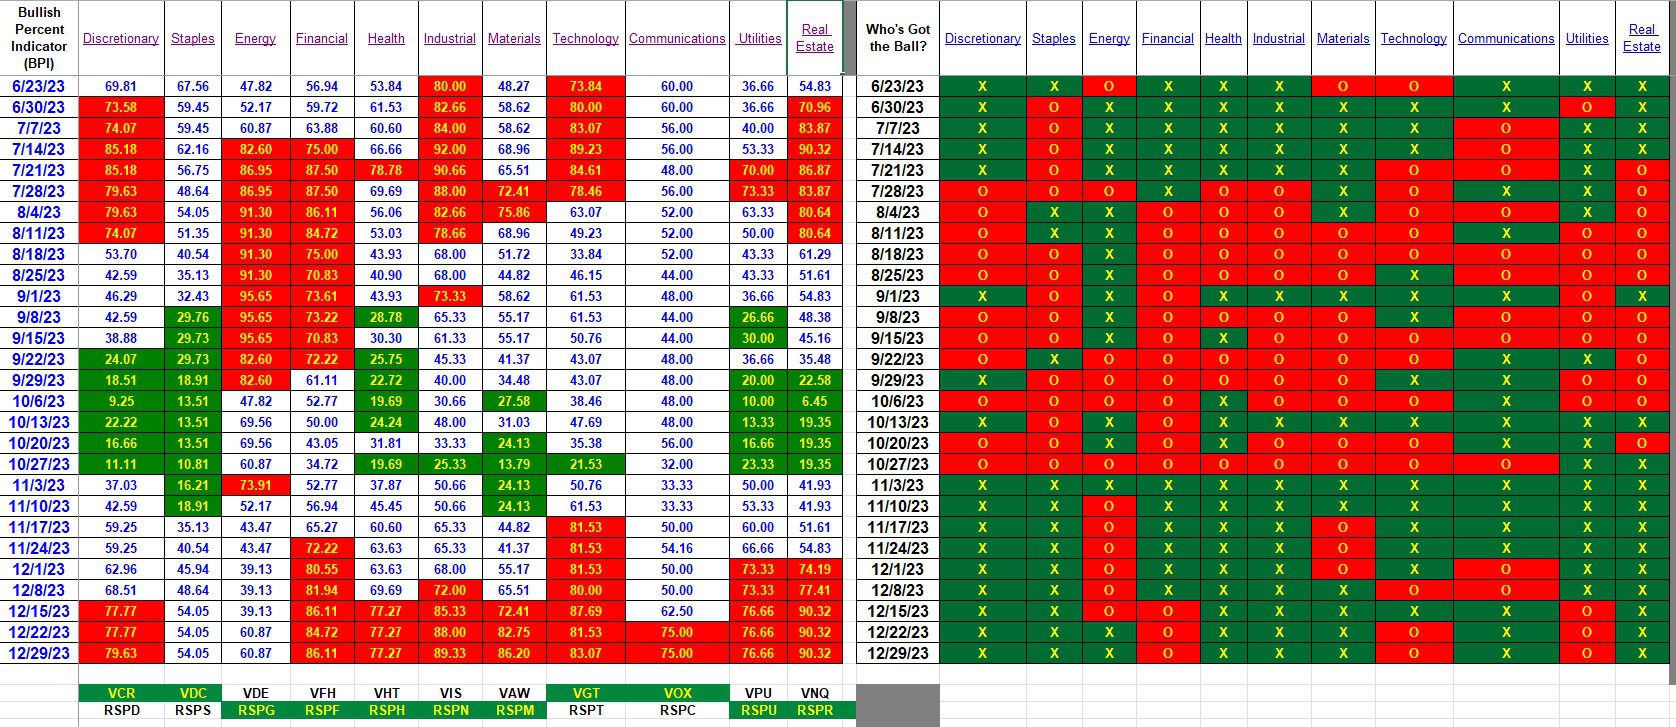
Bullish Percent Indicator (BPI) data is the driving force behind the Sector BPI investing model. In the following blog post the top table gives us a broad view of how the U.S. Equities market is performing. Right now the market is very strong, although it is primarily driven by large-cap stocks. It is the second or sector table that provides guidance as to how we manage the Sector BPI portfolios.
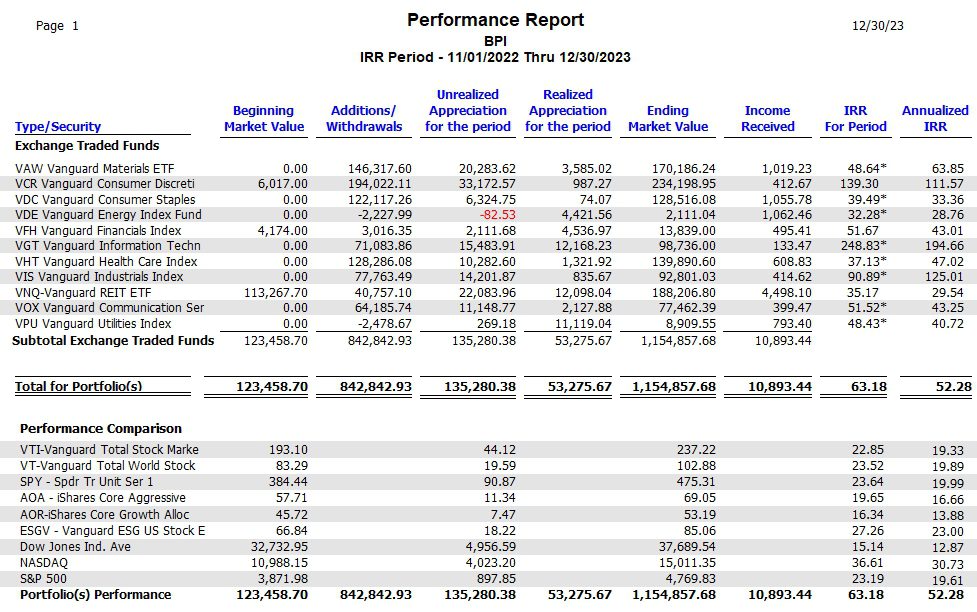
The third table is one I don’t normally include with these two BPI tables. However, this being the end of the year I am posting performance data for the Vanguard ETFs used with the Sector BPI portfolios.
Index BPI
It is encouraging to see the two broad indexes, NYSE and NASDAQ, creeping up as this indicates some of the small- and mid-cap stocks are beginning to show life. The five columns to the right on each half of the table are indicative of large-cap stock behaviors and they are quite bullish.

Sector BPI
Now we come to the interesting section of the blog as this is were we extract guidance as to how to manage Sector BPI portfolios.
All but Staples and Energy are overbought. Trailing Stop Loss Orders are in place for these nine sector ETFs. The TSLO for Technology goes back as far as the middle of November. Utilities (VPU) and Real Estate (VNQ) were sold out of a number of portfolios as the priced dropped 3% despite maintaining an overbought position.
When sectors are sold the money manager can either hold on to the cash or reinvest it in U.S. Equities such as VTI, VOO, or ESGV. Some investors will use only SPY, another excellent choice.

Sector Performance Data
The following data comes from the Investment Account Manager software and shows how well the Vanguard sector ETFs performed for all Sector BPI portfolios tracked here at ITA Wealth Management.
Every individual sector outperformed the SPY benchmark. As a group the annualized 52.3% IRR is nothing short of amazing. I selected the November 1, 2022 as the starting point as most if not all the Sector BPI portfolios were launched on or after that date. Several of the Sector BPI portfolios did not use this model until November of 2023.
We need to see much more data before this investing model becomes more than a hypothetical idea. The following table is an early start.

Questions and comments are always welcome.
Explaining the Hypothesis of the Sector BPI Model
Tweaking Sector BPI Plus Model: 20 May 2023
Tweaking Sector BPI Plus Investing Model: Part II
Leave a Comment or Question