Fishing ship docked in Astoria, OR
Bullish Percent Indicators (BPI) provide a different way of looking at or checking market action. The data provided in the two following tables is quite provincial in that the data focuses on U.S. markets and omits all international markets. Keep that in mind as you peruse the following data.
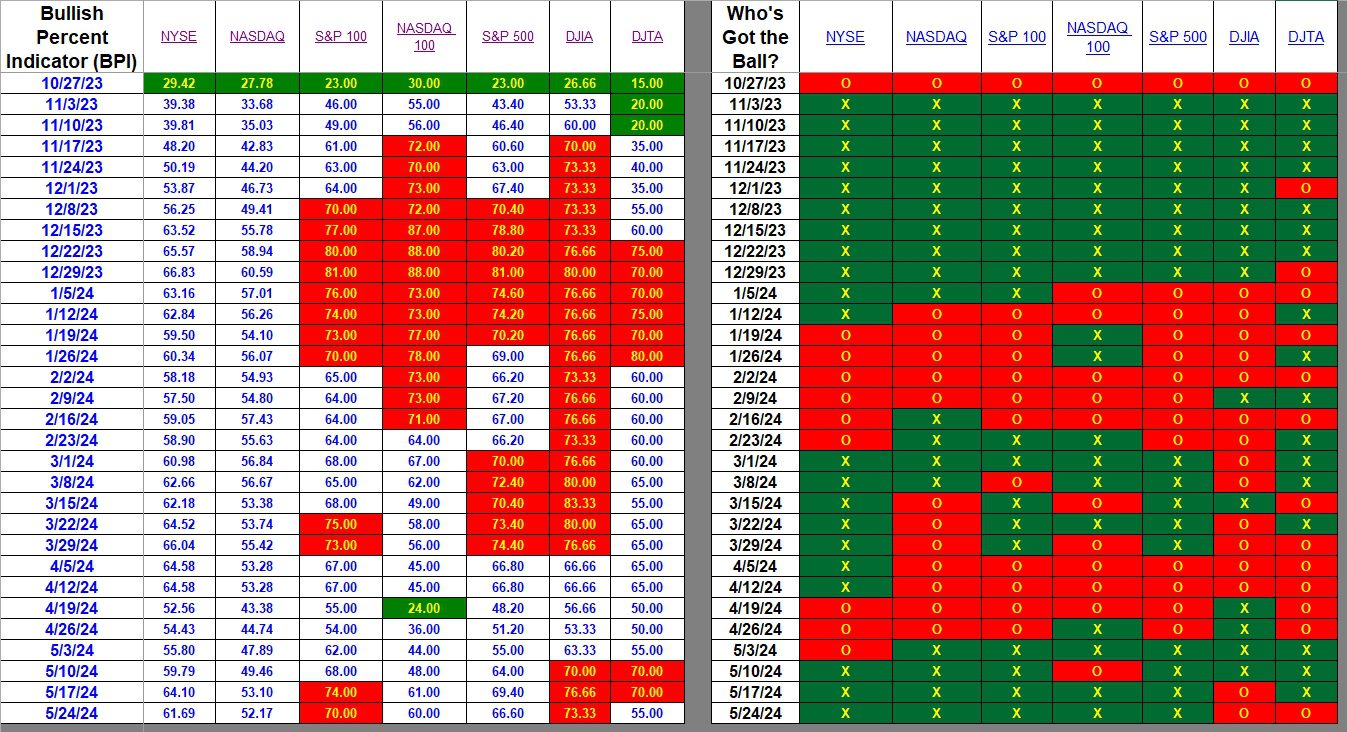
Based on the BPI data, this was not a particularly strong week for U.S. Equities. None of the seven major indexes showed gains in the percentage of bullish stocks.
Index BPI
In the following table, pay most attention to the NYSE and NASDAQ data as these two indexes cover the largest number of U.S. stocks. Next in importance is the S&P 500. While the majority of the indexes are still bullish, on the left side of the table readers will see that every index declined in the percentage of bullish stocks. We still see where the S&P 100 and Dow Jones Industrial Average (DJIA) are overbought as both show a 70% bullish or higher.
This table provides the big picture of the direction of the U.S. Equities market. For a granular view we move to the second table where the market is split into eleven (11) sectors.

Sector BPI
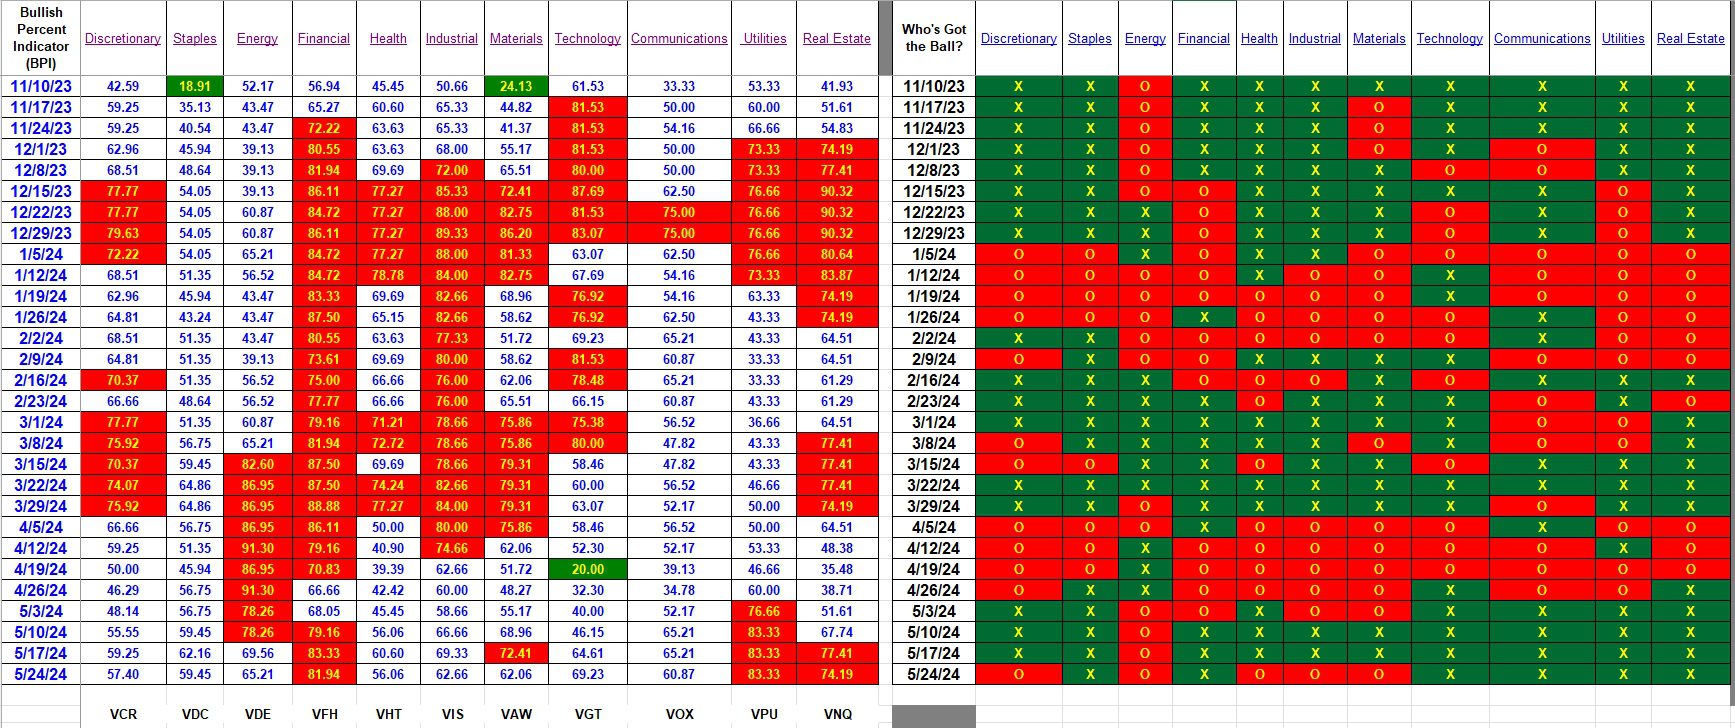
The following table is the key reference for those managing a portfolio using the Sector BPI investing model. If your portfolio is holding Financial (VFH), Utilities (VPU), or Real Estate (VNQ), be sure you have a 3% Trailing Stop Loss Order in place for these three ETFs. In addition, Technology (VGT) reached the overbought zone mid-week so place a 3% TSLO under VGT. As I recall, my Sector BPI portfolios are no longer holding Real Estate (VNQ). Most Sector BPI portfolios are holding VDC, VGT, and VPU, although many shed VPU this past week.
If you are not familiar with the Sector BPI investing model, here are a few references.
https://seekingalpha.com/article/4588979-sector-bpi-model-update
https://seekingalpha.com/article/4616279-sector-bpi-investing-a-contrary-investing-model
Explaining the Hypothesis of the Sector BPI Model

Here at ITA readers can follow several portfolios managed by the Sector BPI investing model. The oldest is the Carson. Others are: Millikan, Gauss, Einstein, Kepler, Franklin and McClintock. Several others are also managed using this model, but the owners prefer I not post the data for viewing. Here is the link to the Carson. You may need to register as a Guest and then wait to be elevated to the Platinum level before you can read the blog post.
Discover more from ITA Wealth Management
Subscribe to get the latest posts sent to your email.
Lowell,
Is there a way to determine how many stocks are in a specific index? I have looked Stock Charts Q&A and did find this: “Indices with over 2000 stocks, such as the Nasdaq and NYSE, are unlikely to reach 0% or 100%. Indexes with fewer stocks are also more volatile because moving the Bullish Percent Index takes fewer stocks.”
Bob P
PS hope you are recovering well from knee surgery.
Bob,
Knee surgery was delayed until July 8th. A big disappointment as I want this to be history.
The NYSE has around 2200 and the NASDAQ contains over 2500. The S&P 100 and NASDAQ 100 each have 100. DJIA has 30. I don’t know how many are in the DJTA.
You are correct about the volatility.
Lowell
I just ran a check to see if any sectors dropped into the oversold zone after a few negative market days. None reached that level. Closest is Health which is now down to 45% bullish stocks.
All sectors except Communications are bearish although three sectors are still overbought. Saturday I will post new BPI data which will conclude May.
Lowell
I just checked the BPI data to see if and sectors dropped into the Oversold zone. None have although all sectors with exception of Discretionary are currently bearish. That might change by the time I update BPI data tomorrow.
Lowell