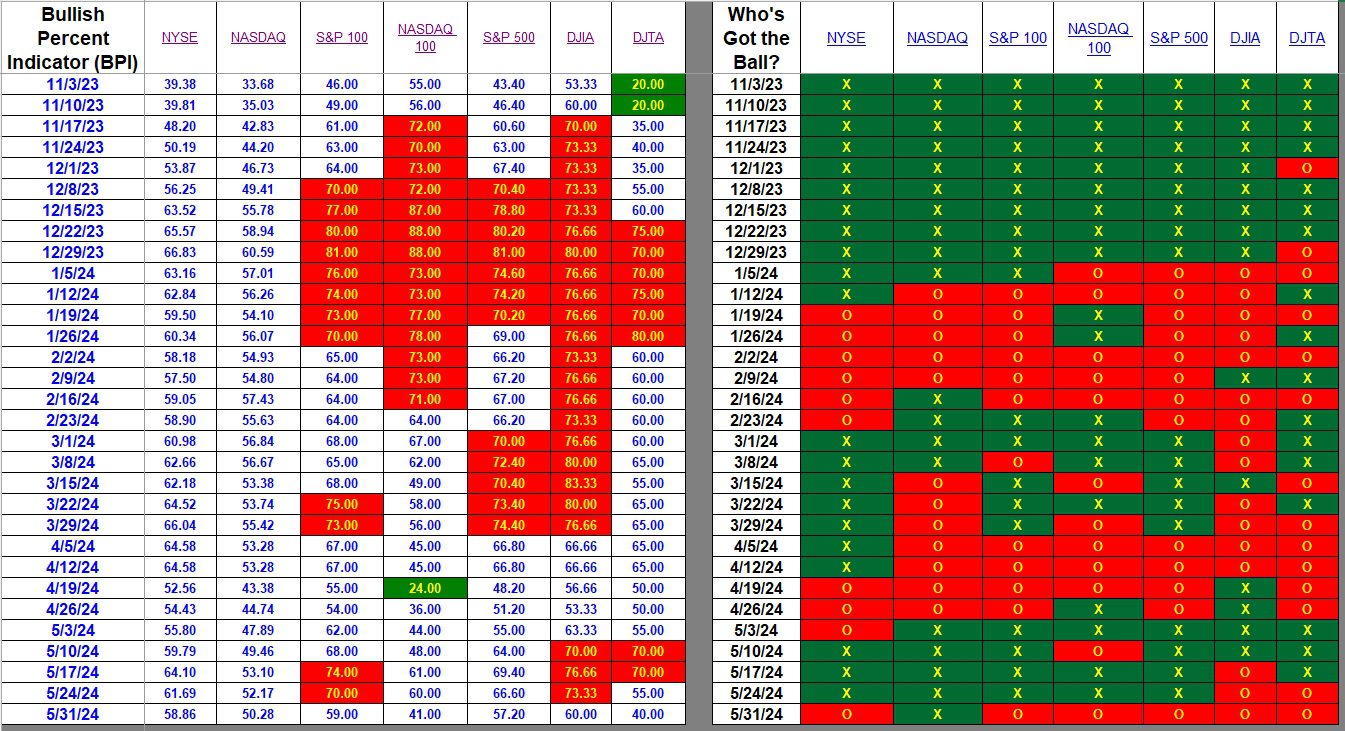
Friday’s uptick near the market close was insufficient to counter the broad decline in the major indexes and sectors of U.S. Equities. I assumed we might see a few sectors turn bullish based on the surge late Friday. Not so. Only one index and one sector are currently bullish and both show weakness when we examine the percentage change this past week.
Readers new to Bullish Percent Indicator (BPI) data need to know this information comes out of Point and Figure (PnF) charting. This is a very different way of tracking market and sector action.
Index BPI
While the NASDAQ remains bullish the percentage point drop moved from 52.17% bullish down to 50.28% bullish. Every major index dropped in the percentage of bullish stocks and in a few cases the decline was significant. Check the left side of the following table. Despite the major decline this week no indexes are oversold. All are hovering in the neutral zone.

Sector BPI
Every sector moved down this week with exception of Communications. This single sector held even with 60.87% bullish stocks. We still have three sectors overbought. While I’ve not checked every Sector BPI portfolio I think most shares of VGT and VPU were sold out of these portfolios leaving Staples (VDC) as the single major sector holding. A few portfolios may still hold a few shard shares of VDE and VOX.
When no sectors are oversold we move available cash into VOO and VTI. There are a few portfolios where the owner will need “education” cash so we hold back on investing in U.S. Equities.
Portfolios such as Huygens, Pauling, Copernicus, and Schrodinger are fully invested. Portfolios carrying cash that is not needed over the next few months have numerous limit orders in place to pick up shares of VOO and VTI. We anticipate buying opportunities will show up later in the summer months.

Explaining the Hypothesis of the Sector BPI Model
The Schrodinger is schedule for an update on Monday with Copernicus to follow on Tuesday.
Lowell,
I entered a position in VGT on that brief down tick in April. On 5/23 it had a brief up tick to 70.77 and I entered a sell at 3% those all hit Friday locking in some profits. I find it useful to check the stockcharts BP$ when things are close to buy or sell signals. BTW my total profit on sector trades since summer 2022 is 8 1/2%. This does NOT include $ in the market ETFs only the sector ETFs.
Bob W.
Bob,
Keep me informed as to how your Sector BPI portfolio is performing. Launch time seem so be quite important as to overall performance. This is why more history is required to come to any conclusions.
Lowell