Water sluice at Cedar Creek Grist Mill on the Lewis River.
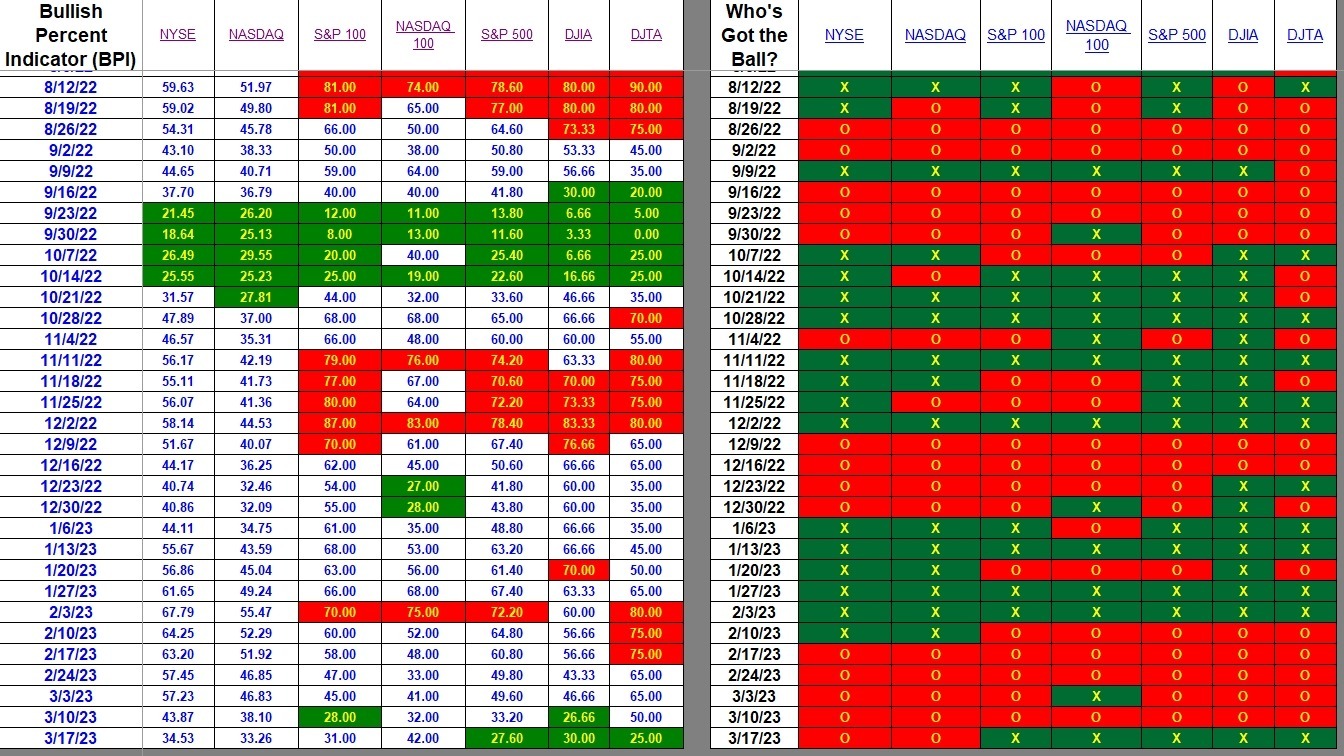
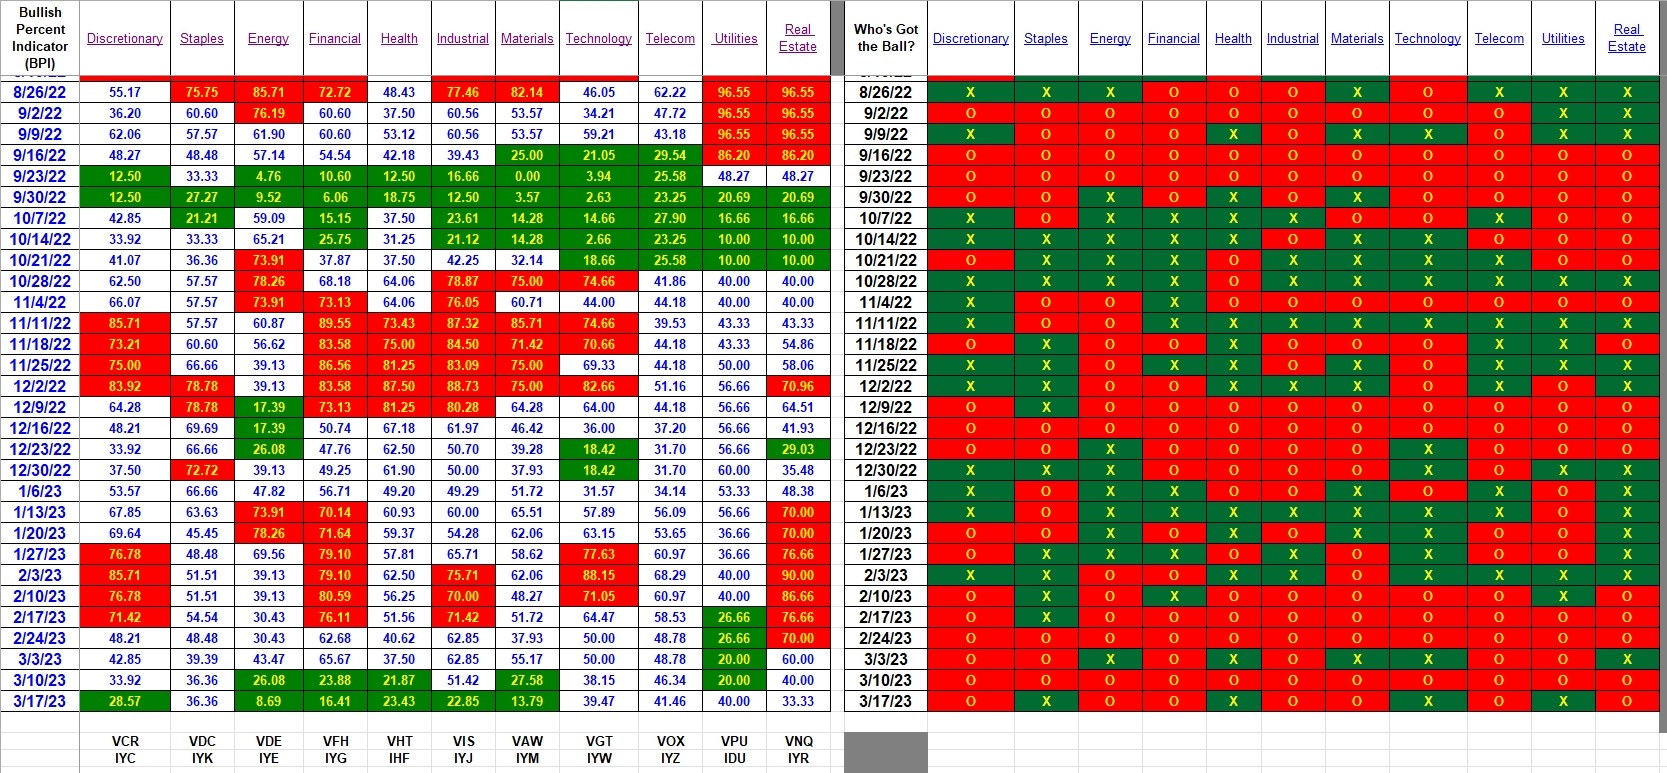
This week the Bullish Percent Indicators produce interesting information as well as several anomalies. If you are an investor interested or already using the Sector BPI model, there is new information for readers.
Index BPI
Friday’s market action produced several anomalies. For example, check out the S&P 500 and Dow Jones Transportation Average (DJTA). Both indexes show percentage drops into the over-sold zone, yet are bullish when one checks the information found on the right-hand side of the following data table. When this happens there is an uptick in bullish stocks, generally on Friday, within the index, but over the entire week the trend was downward. I refer to these situations as anomalies. When in doubt, pay more attention to the percentage shifts on the left side of the data table.

Sector BPI
Now we come to the sectors of the U.S. Equities market. Six of the eleven sectors are over-sold. Staples, Technology, and Real Estate are very close to the over-sold zone or when 30% or fewer of the stocks within the sector are bullish when examined on a Point and Figure (PnF) graph.
With so many sectors in the over-sold zone, how does not determine which sectors to fill when working with a specific Sector BPI portfolio. I’ll go into more details when the next Sector BPI portfolio comes up for review, but in the meantime here is my thinking.
- Fill each over-sold sector with a few shares. It might be as few as five shares. Take a small position in each over-sold sector.
- Then begin to completely fill the sectors beginning with the most over-sold sector. That means fill Energy first and then move on to Materials, Financial, Industrial, Health, and Discretionary in that order.
This coming week I will update the Carson and Franklin Sector BPI portfolios. That leaves the Gauss and Millikan as potential updates later in the week.

Explaining the Hypothesis of the Sector BPI Model
Carson Portfolio Update: 18 November 2022
Hi Lowell Im very interested in your BPI investment model since I have had an interest in Xs/Os for years but have never found a way to make i† profitable for me. Last week I began the process of trying the BPI model out by buying a few shares of VPU and VHT. Nearly all of my current positions
were down slightly last week except for VPU and VHT both of which were up slightly. It is a trifle early to declare total victory over the mk but it is reassuring. I am aware of the Confirmation bias
operating here but is still a positive start for me as I try this model out. Thx John Shelton
John,
It will be interesting to hear back from folks who are experimenting with the Sector BPI model. As I keep saying, I need to see a few Buy/Sell cycles to have a sense as to how effect this model is. The hypothesis is sound, but that does not mean it is “full-proof.” The model is now in a Buy mode.
Lowell
My question for everyone is: what is your actual ‘buy’ signal? Is it when the BP P&F chart moves down to the 30 region, or does the system force a wait until the BP chart moves up the (Dorsey Wright recommended) 6 percentage points (3 * 2% boxes)? Or do you wait until the Sector ETF moves up once the oversold signal is flagged?
Just curious. There are a lot of ways to play this.
Craig
PS. The ‘sell’ side would have symmetrical signals at 70?
Craig,
The first round of buying I did in 2022, I waited for the <30% signal. At that time Lowell had suggested buying additional shares if the BP continued decreasing. and I did for VOX, VGT and VAW. VAW and VGT worked out with profits, VOX lost a little bit. During this cycle I bought on two sectors that hit 30.1% and then moved up a little. So far I could have bought them for less as the market stalled. So that's what we're trying to learn – hopefully some folks are trying the Dorsey approach. If we get a signal on additional sectors I will probably apply the Dorsey suggestion.
Bob W.
Craig I am sorry to respond so late to your post – I briefly out of town until late
Sunday. My System 1 Fast Thinking (which I have learned to rarely trust) tells me that a 3 Xs reversal might add to Lowel’s good work. Despite my misgivings
regarding my intuition I am going to track this idea. Thx 4 your good remarks. John
Craig,
If you follow the “Dorsey” model, be sure to accurately track the annualized Internal Rate of Return percentage as well as the Jensen Performance Index. Then we can compare results.
An update of the Gauss will appear tomorrow and I plan to work on the Carson, Franklin, and Millikan this week as we have those six over-sold sectors to consider.
Lowell
I see what is happening now!
We are ALL intrigued by the Sector BPI system, and we (all) have different ideas on the buy/sell signals! This is going to be fun (and I hope profitable).
Let’s see what happens.
Craig
John,
I also bought the “new” sectors last week but am carrying some from the previous signals or very close to signal levels. I’m down about 3% over all with all sectors in the red. In the previous cycle Sept. to December total performance was about 6.5% up.
Bob W.
Bob W.,
Are you able to compare your portfolio results with the S&P 500? While none of us enjoy seeing negative numbers, if the portfolio is outperforming the S&P 500 (SPY) the pain is not quite as severe.
Lowell
Lowell,
Yes I have IAM. Let me work on that tomorrow.
Bob W.
Lowell,
My sector IRR according to IAM is -0.4%, and S&P is +2.8%.
Bob W.
Lowell:
Here is what I am thinking about for my Sector system:
1) For consistency’s sake, I would assume you want me to use the Vanguard Sector ETFs, or can I use the SPDR Sector ETFs? Your call on this.
2) For allocation percentages, I will use a risk-parity approach over the sector ETFs, using the reported beta’s (n.b., the inverse beta’s will actually be used to compute the allocations percentages), and will be updated annually.
3) Entries & Exits – I will use the Dorsey Wright recommendations, from their book “Tom Dorsey’s Trading Tips – A Playbook for Stock Market Success”:
a) Entries – Sector BP below 50% and on X’s; Sector RS (computed on StockCharts.com using the division operator with SPY; for example XLC:SPY) on X’s; Sector ETF on X’s
b) Exits – Sector BP above 50% on O’s; Sector RS on O’s; Sector ETF on O’s
The entries and exits are very restrictive (maybe too much so). Today (Monday, 3 p.m.) the SPDR Communications, Technology and Utilities sector ETFs are on X’s for both the bullish percent and the chart. However, only the Communications and Tech Relative Strengths are on X’s (Utilities are not). According to these rules, only the Communications and Technology ETFs would be bought.
a) Entries – Sector BP below 50% and on X’s; Sector RS (computed on StockCharts.com using the division operator with SPY; for example XLC:SPY) on X’s; Sector ETF on X’s
b) Exits – Sector BP above 50% on O’s; Sector RS on O’s; Sector ETF on O’s
Craig,
This will involve quite a bit more trading that the model I’m following. Should be interesting.
Lowell
Lowell,
The kicker here is that you have to satisfy 3 screening criteria. The BP criterion is actually “close” to 30 and 70, but some of the sectors may have difficulty reaching those levels. I will monitor to see. I will be monitoring on a weekly basis.
I just checked the BPI data and Discretionary moved above the 30% line. If I had any limit orders for VCR that were not triggered I’ll leave them in place, but not set any more for VCR.
This leaves five sectors in the over-sold zone.
Lowell
Lowell,
I purchased VIS and VCR today for 3 portfolios based on the close of Friday BPI. I now hold 6 sectors in these portfolios.
Bob W.
BPI Update:
I just finished updating the BPI sector spreadsheet and there are two changes. Health moved out of the over-sold zone so I would not purchase any more VHT. Replacing Health is Real Estate (RE) as RE dropped from 33.33% bullish down to 16.66% bullish. If you are updating a Sector BPI portfolio tomorrow, as I will be, then purchase shares of VNQ or IYR.
According to my volatility calculation, I plan to build Real Estate up to 15% of the total portfolio, assuming cash is available.
Tomorrow look for a review of the Franklin portfolio, one of four Sector BPI portfolios tracked here at ITA.
Lowell