
Pelicans, Cairns, Australia
US Equities continued their steady climb this week hitting new all-time highs at the close on Friday:
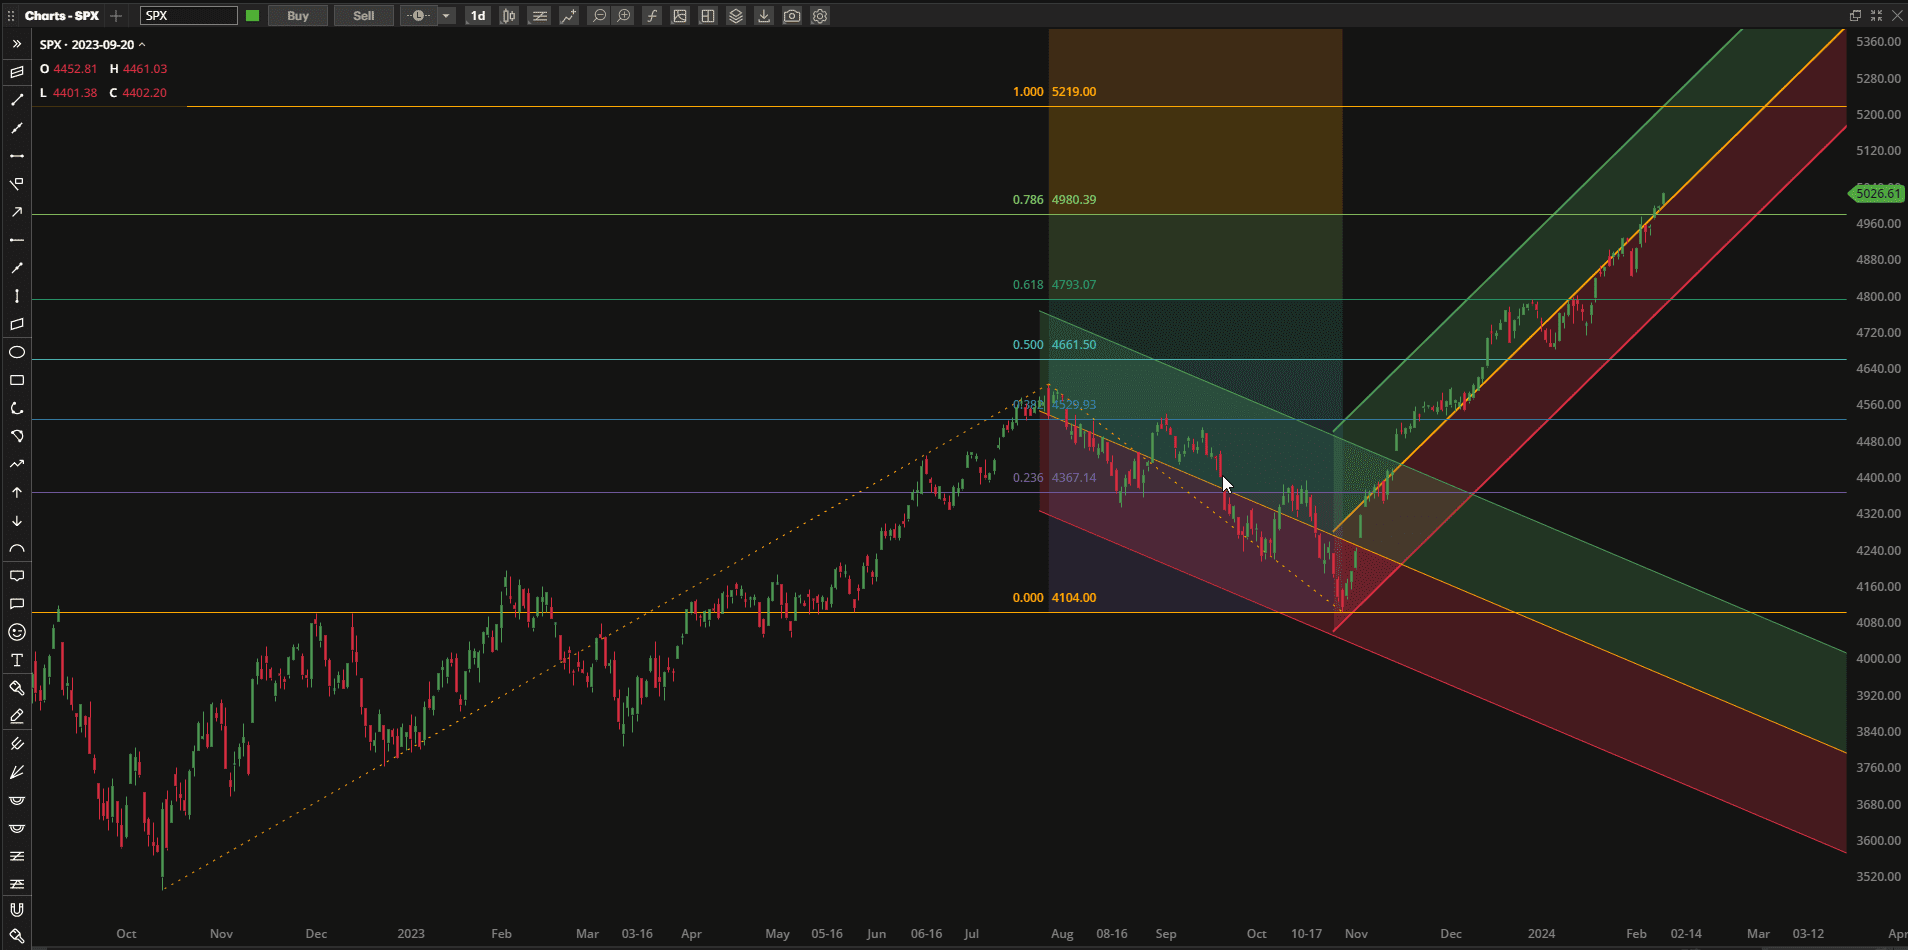 Since we are at all-time highs, with no obvious indications of the next resistance level, the best I can do is look at the 100% Fibonacci extension from the November lows – that suggests possible resistance at~5200 if we can continue this bullish trend.
In terms of performance relative to other major asset classes US equities again appears near the top of the List:
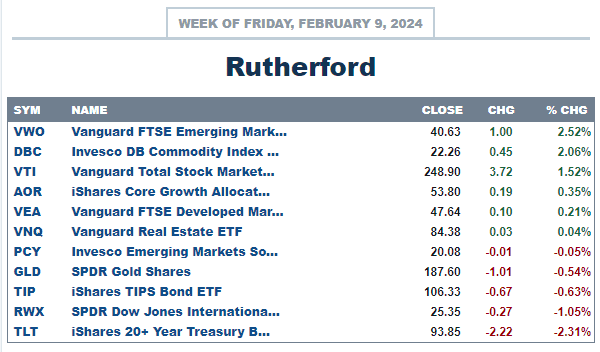 only being beaten out by Emerging Market equities and commodities.
Current holdings in the Rutherford Portfolio look like this:
 with a strong bias towards equities. However, in Tranche 1 (the focus of this week’s review) we see holdings in Real Estate. Checking on performance:
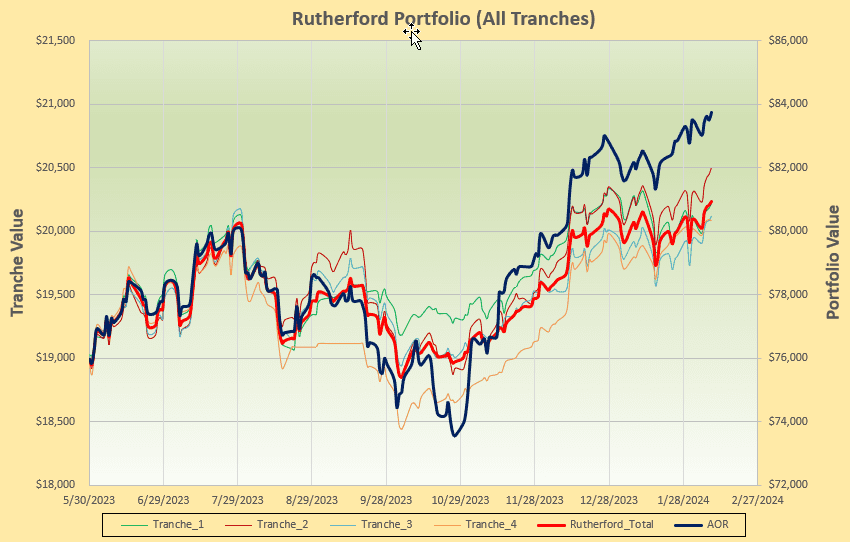 we see a general reflection of the trend of the benchmark – so let’s see what the rotation graphs are saying and whether any adjustments are recommended:
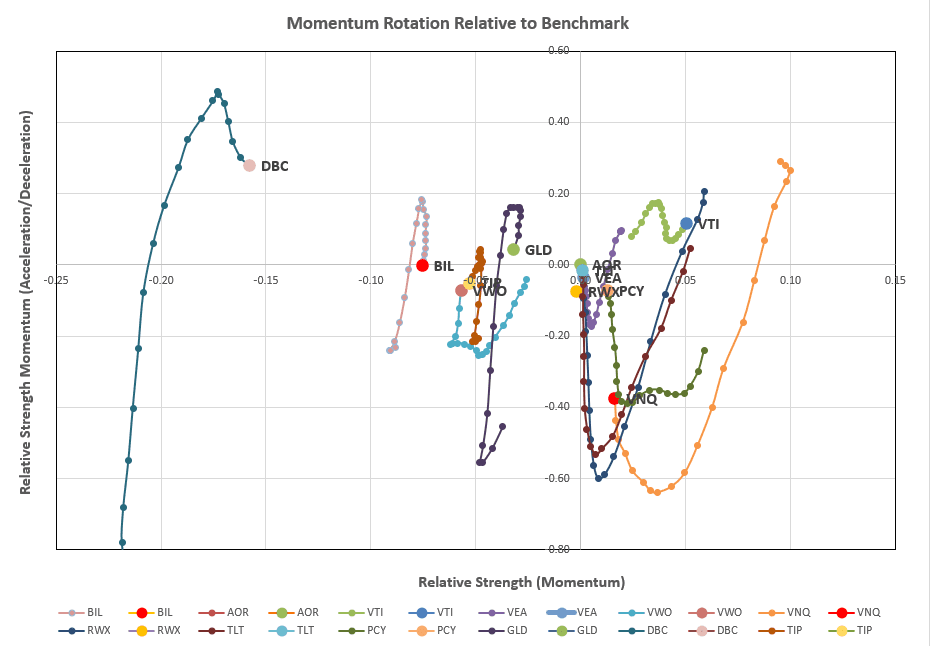 From the rotation graphs we note that only VTI (US Equities) is sitting in the desirable top right quadrant of the graph so we’ll take a look at what the rotation algorithm is recommending:
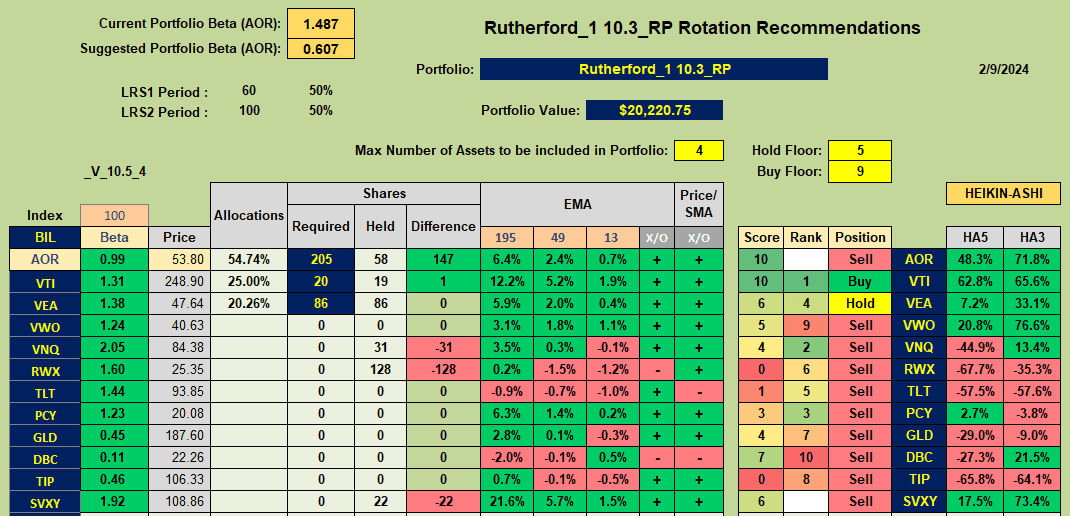 where we note that only VTI is recommended as a Buy, with VEA getting a Hold recommendation (since we currently have a position in this ETF). Real Estate and Bonds look out of favor so adjustments for this week will look something like this:
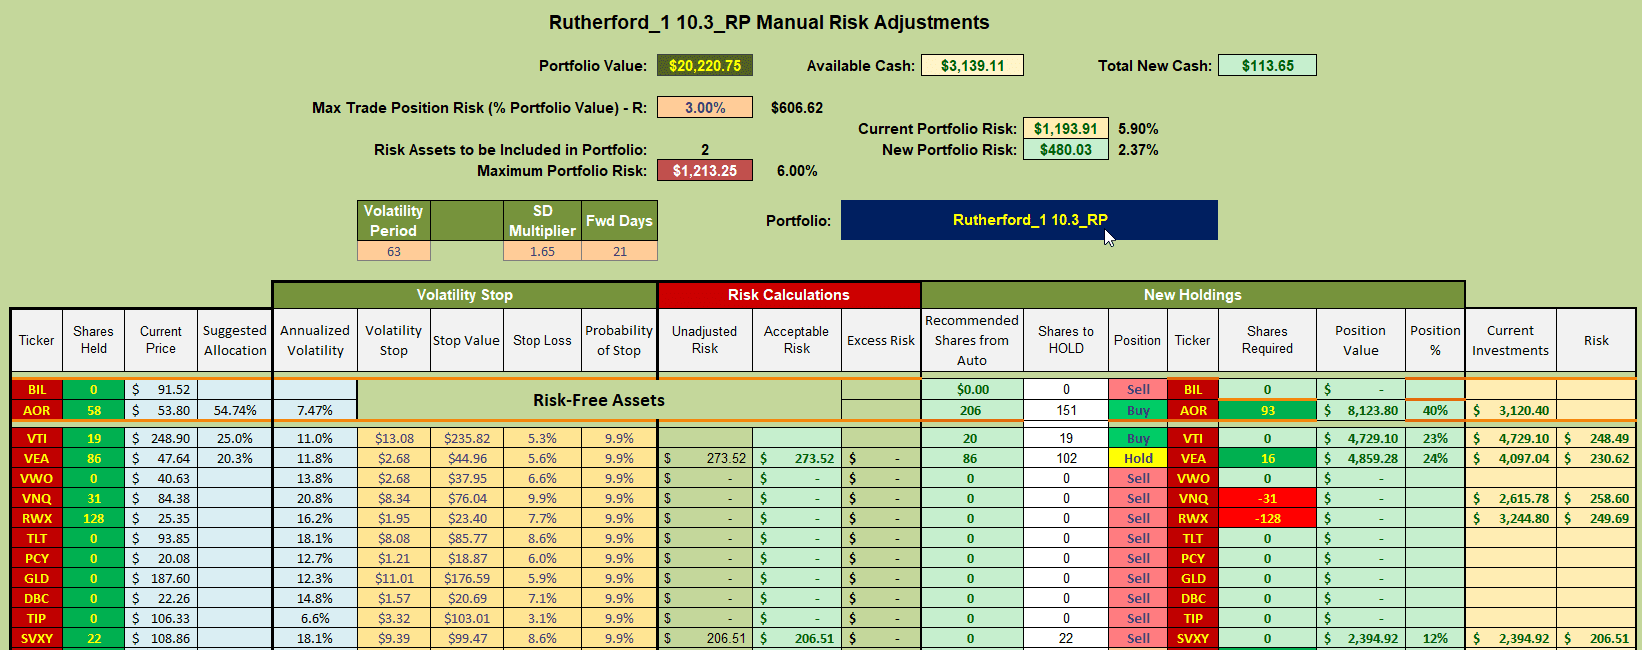 where I shall be selling current holdings in VNQ and RWX and using the proceeds to Buy shares in AOR (the benchmark fund). I will not add more shares of VEA since the recommendation is to Hold rather than Buy.
Discover more from ITA Wealth Management
Subscribe to get the latest posts sent to your email.
You must be logged in to post a comment.