
Small Boutique Hotel in Bangkok, Thailand
The past week was a bullish week for US equities:
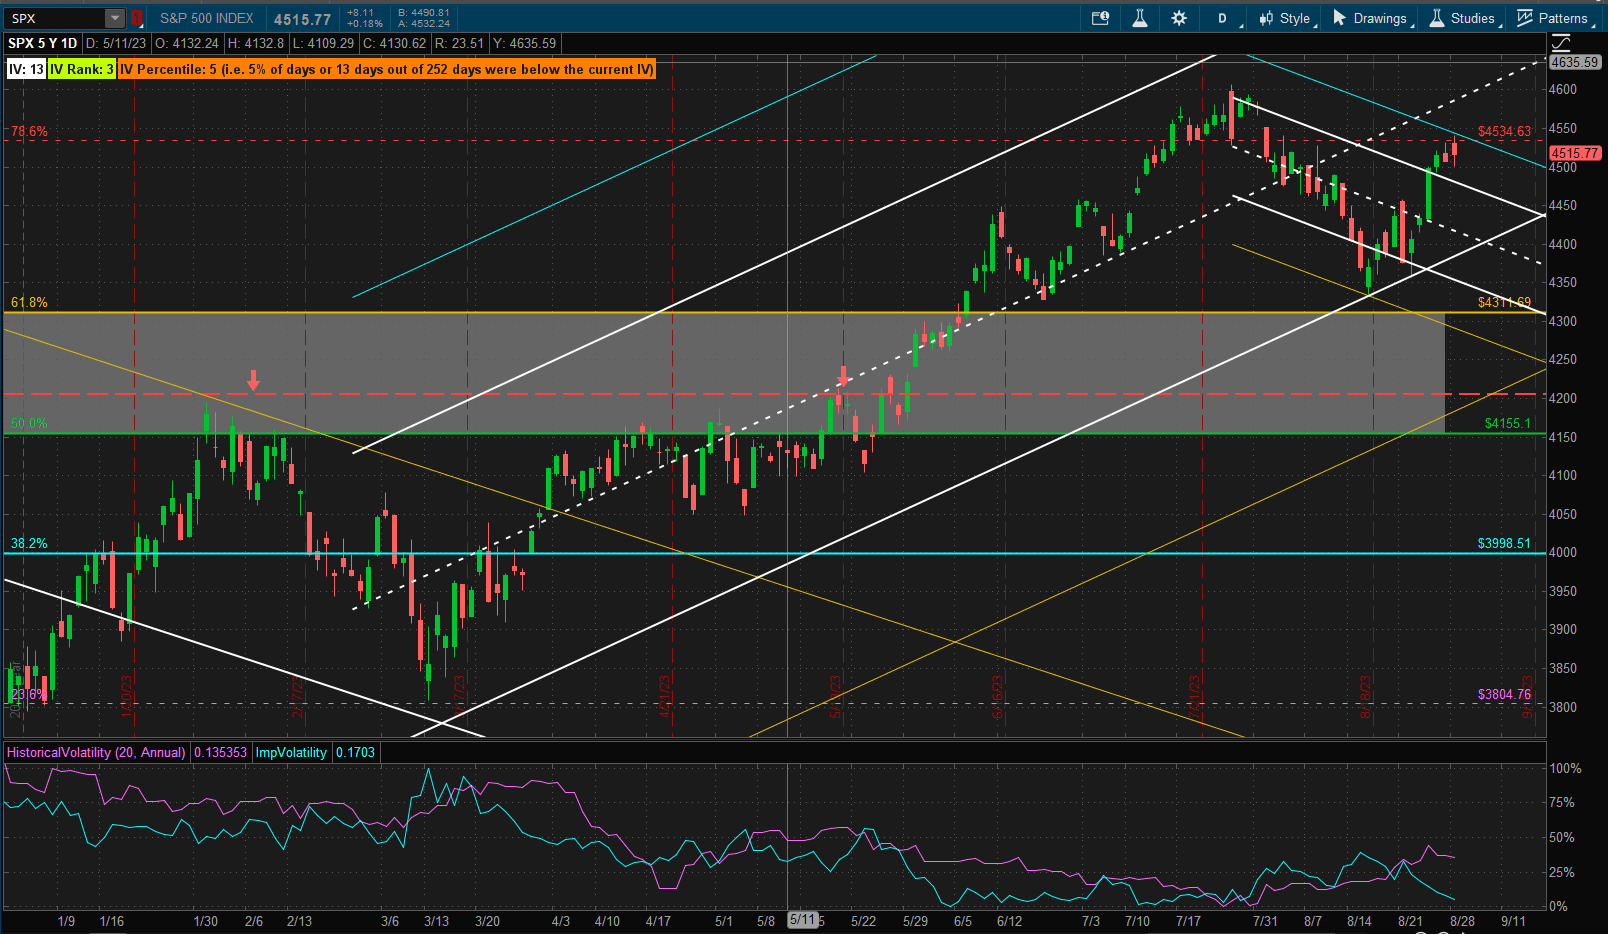 with SPX showing a 2.5% gain on the week. We have bounced nicely off the lower 1 SD boundary of the bullish channel and the 4300 support area and headed for the centre line – that is encouraging. However, the bearish candles of the past 2 days may be a clue that we are at the upper 1 SD boundary of a new downtrend channel. Who knows? – we’ll just have to see how next week plays out.
In the meantime a look at the performance:
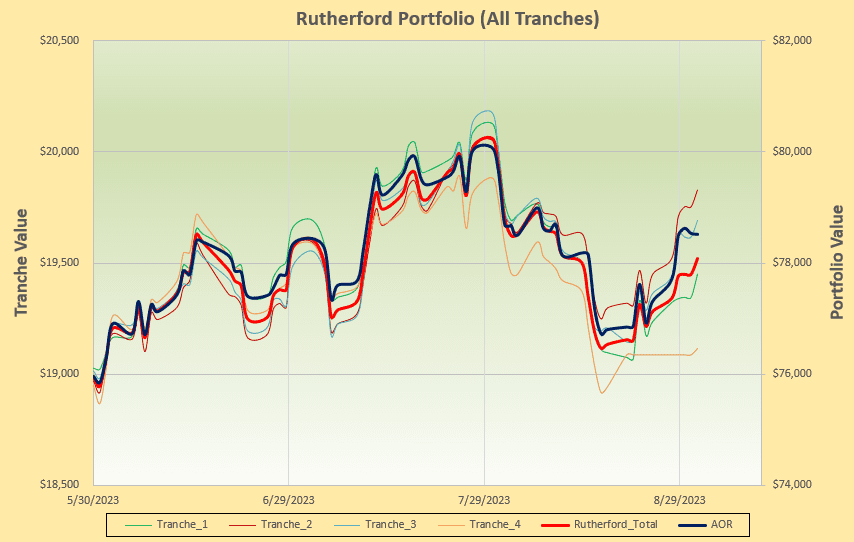 of current holdings:
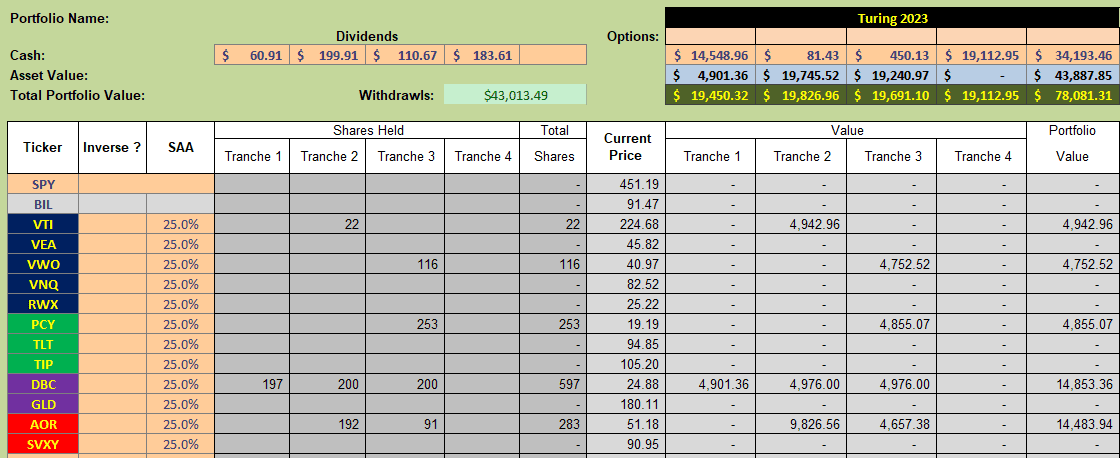 shows a recent divergence of performance of the individual tranches with a slightly poorer performance of the portfolio relative to the benchmark AOR Fund. This indicates a rather high degree of uncertainty.
In terms of performance relative to other major asset classes US equities came out on top:
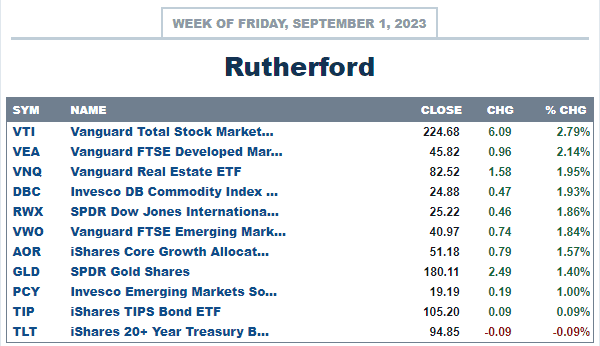 although only long-term US treasuries (TLT) generated a negative return.
I am going to make a minor tweak to the management of this portfolio. If you check my earlier post on the Darwin Portfolio you will see that I have suggested investors consider adding a small allocation of their holdings to a Volatility ETF – specifically SVXY, an inverse volatility product (i.e. SVXY makes money when volatility decreases – with some subtle technical details related to “drag” in futures pricing). I am therefore going to follow my own advice and allocate 10% of portfolio value to SVXY in the Rutherford Portfolio. This is a little risky at the present time since Volatility is relatively low in comparison to recent prices (although not necessarily so on a historical basis). I will therefore dollar cost average these aquisitions over the next 4 weeks as I adjust the individual tranches.
In addition. rather than equal weighting of the recommended assets (I am not changing the rotation model recommendations) I shall be allocating funds based on Risk Parity with a 3% target volatility for each asset. I am guessing that this should result in an overall volatility for the total portfolio of ~8% – but we’ll see as I will track this as we move forward once these management/allocation changes have been applied to all 4 tranches.
Starting this new management scheme I check the rotation graphs:
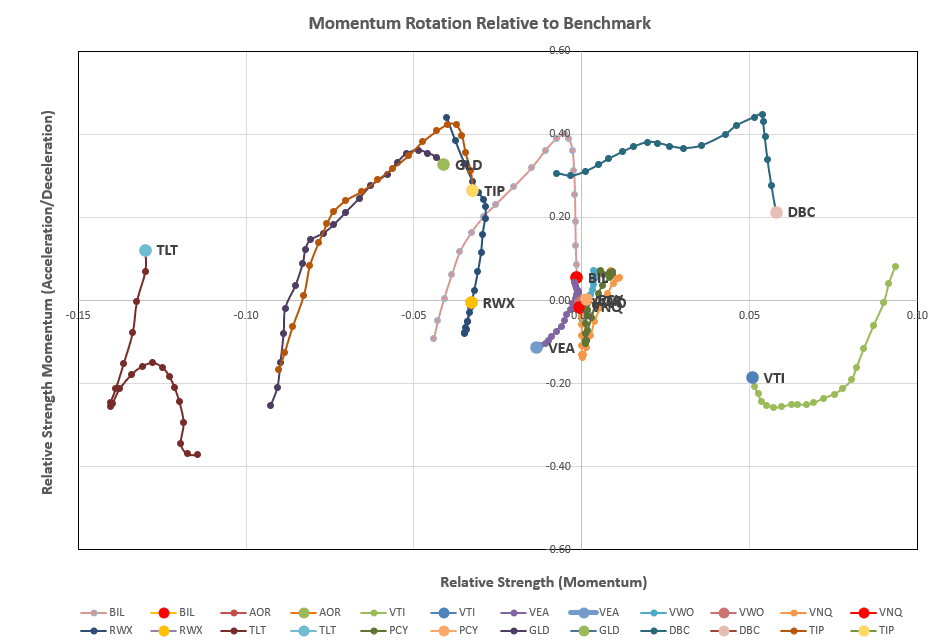
where we see DBC with the strongest long-term momentum – furthest to the right (but dropping in the shorter term) followed by VTI (and strengthening in the shorter term).
Checking the recommendations from the Tranche 4 sheet (the focus of this week’s review):
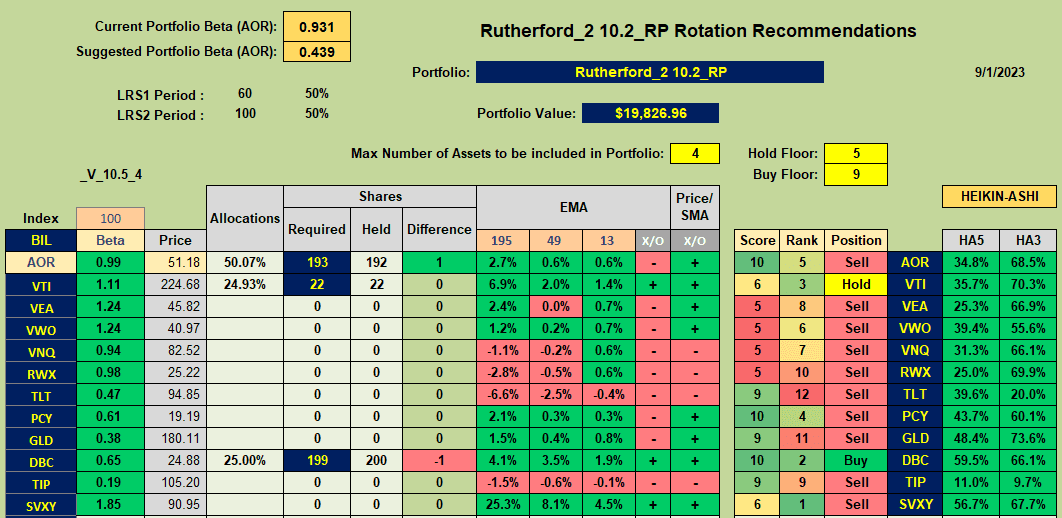 we see that DBC has a recommended Buy recommendation and VTI is recommended as a Hold. AOR, despite it’s max 10 Score, is recommended as a Sell due to the fact that the 13EMA is below the 49 EMA.
Consequently my plan is to adjust as follows:
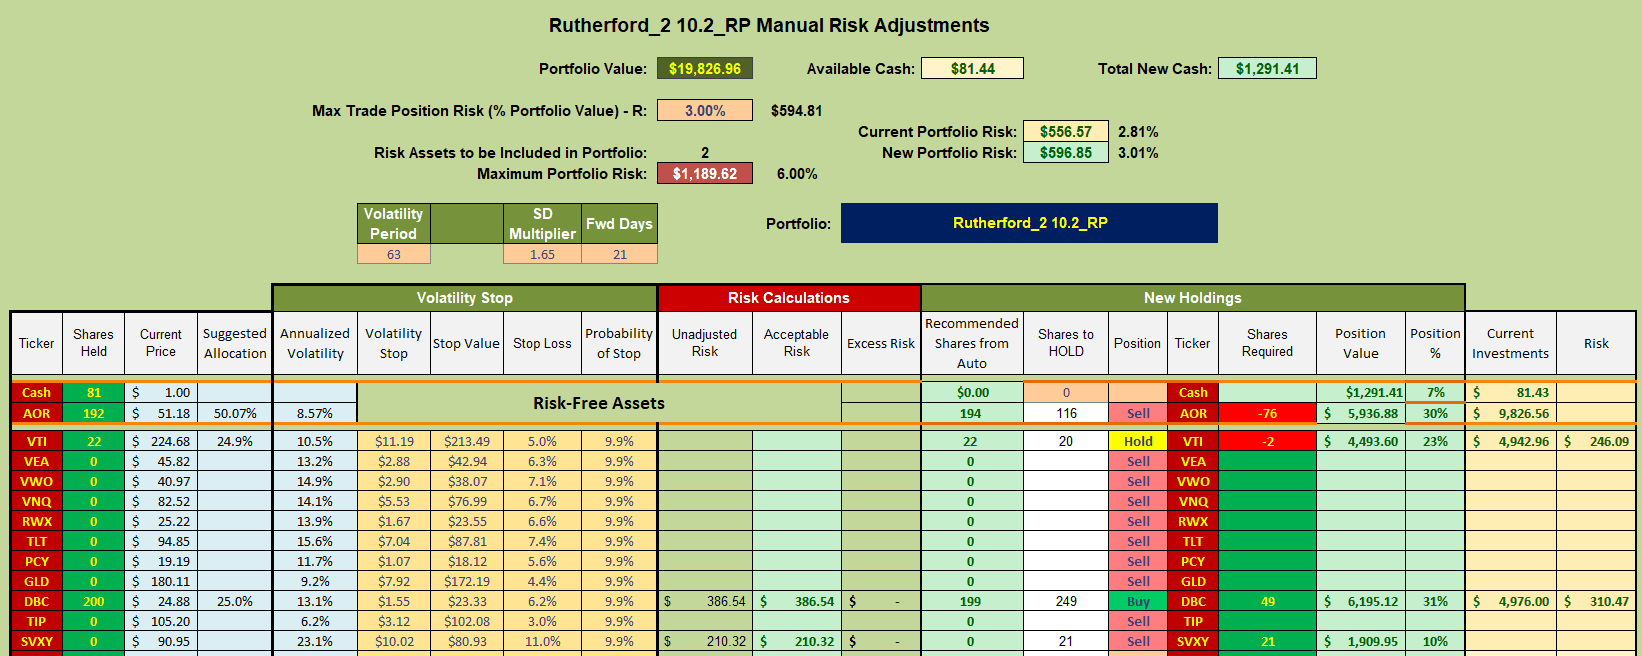 i.e I will sell 76 shares of AOR and Buy 49 shares of DBC. These allocations are based on Risk Parity (with 3% target volatility). The allocations are not too different from the equal weight allocations (compare the numbers in the column with the white background – Shares to HOLD – to the numbers in the column to the left). Because I have to pay commissions on the sale of shares I will not adjust the VTI position at this time. The other action will be to Buy 21 shares of SVXY (~10% Tranche value).
Let’s see how this goes once I have all 4 tranches adjusted to the new allocation model.
David
Discover more from ITA Wealth Management
Subscribe to get the latest posts sent to your email.
You must be logged in to post a comment.