David (replica) by Michelangelo in Florence, Italy.
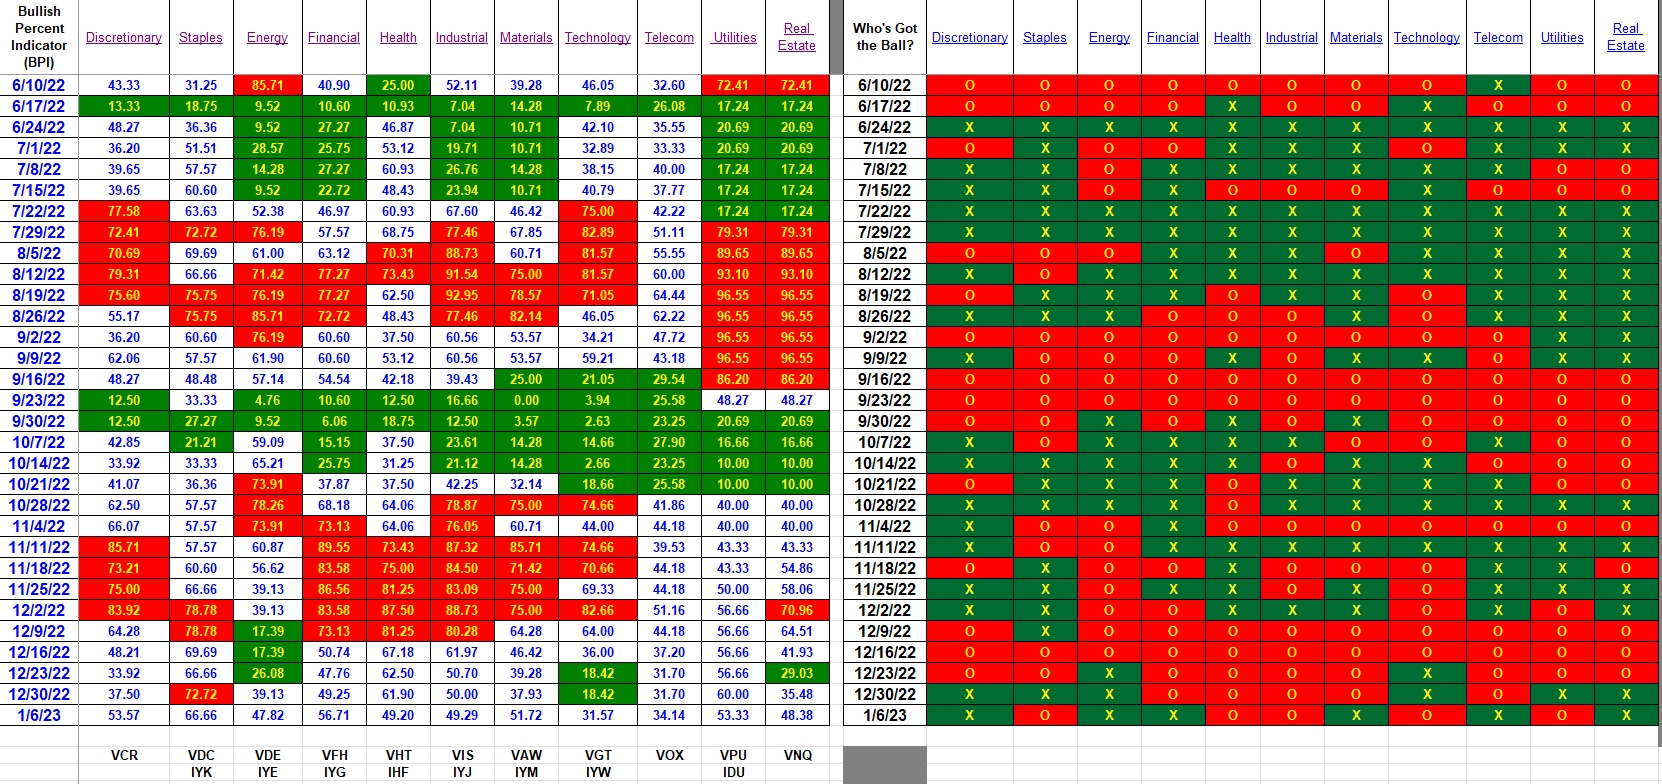
Bullish Percent Indicators for this first week in January indicate no sectors are over-sold. Technology move above the 30% bullish line yesterday as it was the lone over-sold sector on Thursday. If you are managing a Sector BPI portfolio and using end-of-week data, you will do nothing this week. Follow along.
Index BPI
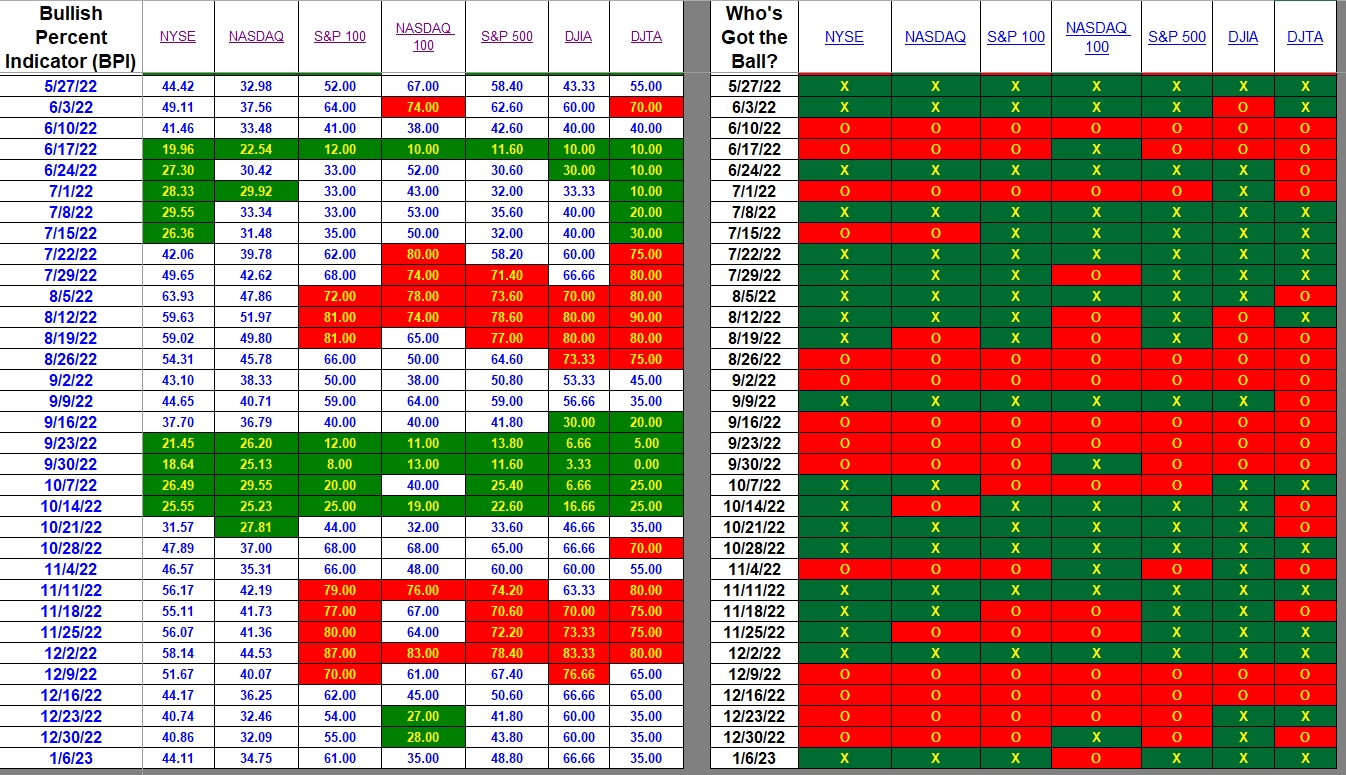
Overall, the indexes indicate an up week when one checks the right side of the following table. Only the NASDAQ 100 is bearish while the broader NASDAQ turned bullish. Also of importance is that the broad NYSE moved from bearish to bullish.
When checking the percentages found on the left side of the table, every index showed an increase with exception of the DJTA which remained constant at 35% bullish.

Sector BPI
Now we come to the sector BPI data or the information used to manage Sector BPI portfolios. On the right hand side of the table we see very mixed bullish and bearish movement.
The left side is critical to our decision making. We see neither any sell signals or buy signals as not one sector is either over-bought or over-sold. When I update the Carson on Monday, I’ll do nothing.
One possible suggestion, assuming there is cash in the Sector BPI portfolio, is to set a limit order for VGT that is 10% below the current price as a 10% drop will certainly move the Technology sector into the over-sold zone or something less than 30% below the bullish line. Such a decision is outside the basic rules for managing a Sector BPI portfolio. This is not necessary in my case as I’m tracking several such portfolios and will be updating the BPI data throughout the week.

Explaining the Hypothesis of the Sector BPI Model
The ITA blog is now free to all who register as a Guest. Spread the word to your friends and relatives and I thank you in advance.
Discover more from ITA Wealth Management
Subscribe to get the latest posts sent to your email.
You must be logged in to post a comment.