Example of Inca wall construction.
Based on yesterday’s market decline, today seemed like a good time to check in on the Copernicus as this portfolio is constructed only of U.S. Equities. The philosophy behind the Copernicus is to save and invest. Never sell unless there is an emergency. How is this portfolio performing on a return and risk basis? When one invests only in equities it is considered a high risk portfolio. What do the facts say?
Copernicus Investment Quiver
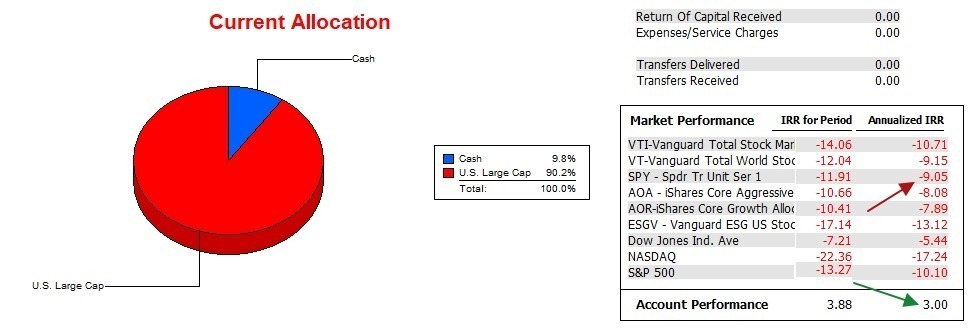
I use four U.S. Equity ETFs to build the Copernicus. They are: VTI, ESGV, SPY, and/or VOO. There is a high correlation between all these ETFs and one could use any one to build a similar portfolio to the Copernicus. A mutual funds such as VFINX would also work fine. ESGV is priced much lower than the other three ETFs so if one is running low in cash it is possible to “sneak” in a share or two of ESGV so as to remain fully invested. The Copernicus current holds 10% in Cash or a rather high percentage for this portfolio. I have limit orders in for all four ETFs in hopes of picking up shares at a lower price. This is a hedge against the debt limit mess in congress.

Copernicus Performance Data
Since 12/31/2021 the Copernicus has an annualized return of 3.0% while the S&P 500 (SPY) annualized return is -9.0%. This -9.0% is actually a little higher than the index itself (-10.1%). A 12.0% difference is not insignificant and will be difficult to maintain unless I am able to find buying opportunities during market dips.

Copernicus Risk Ratios
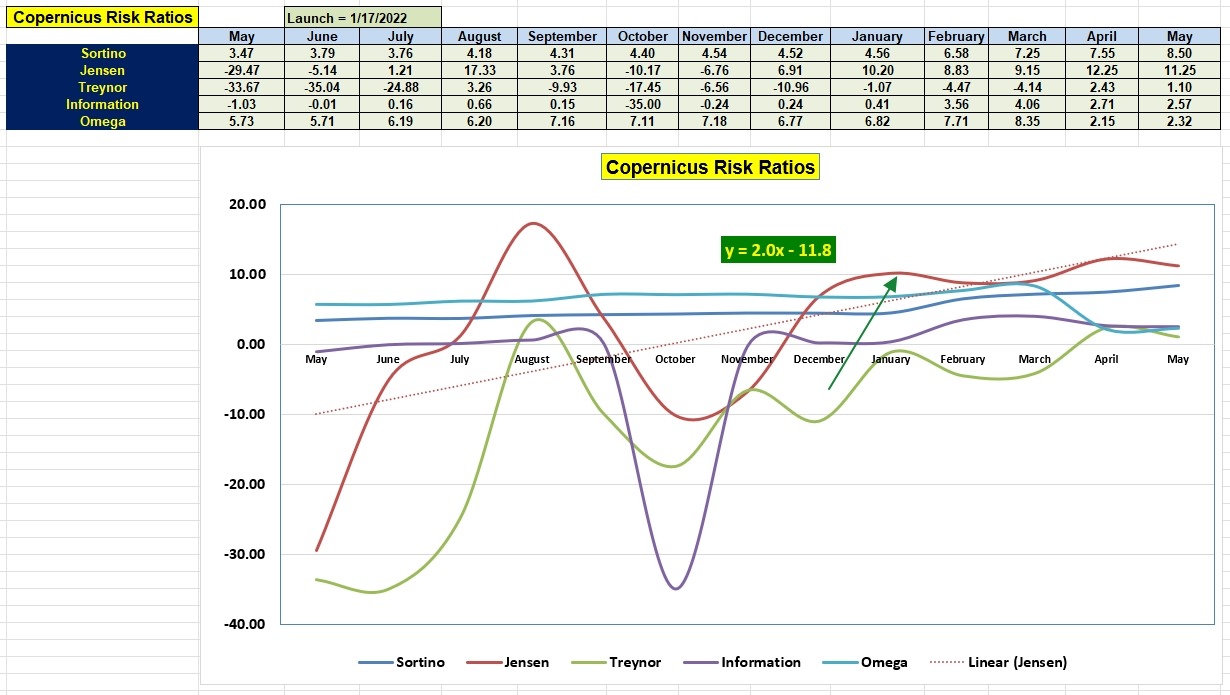
How well is the Copernicus performing based on risk. Since we are investing only in U.S. Equities, this is anything but a well diversified portfolio. Certified financial advisors would never place their clients in this situation. Yet check the results.
- The Sortino Ratio indicates the portfolio is gaining in value.
- The Jensen Alpha or Jensen Performance Index is a very high 11.25. I think this is the highest value of any of the ITA portfolios. It is certainly much higher than the computer managed asset allocation Schrodinger portfolio.
- The slope of the Jensen is a very high 2.0.
- The Information Ratio speaks well as the portfolio is outperforming the SPY benchmark.
The Copernicus is performing very well due to the principle of dollar-cost-averaging. When the market dipped in 2022 new cash was used to buy equity shares at lower prices. As the market rebounded those shares purchased at lower prices improved the Internal Rate of Return (IRR) percentage.
With the debt limit crisis coming closer each day without a solution the Copernicus is set to benefit from a 10% to 20% market drop. How? I have limit orders set to pick off shares at lower prices dipping down as low as 20% below current prices.

Portfolio Management When Facing Debt Limit Differences
ITA Portfolios: Summarizing Investing Approaches
Discover more from ITA Wealth Management
Subscribe to get the latest posts sent to your email.
You must be logged in to post a comment.